
Margin debt hit a new high in January, up $150 billion over four months. Large-cap indices, however, have gone sideways since late October; this is also the case with small caps, but only since early January.
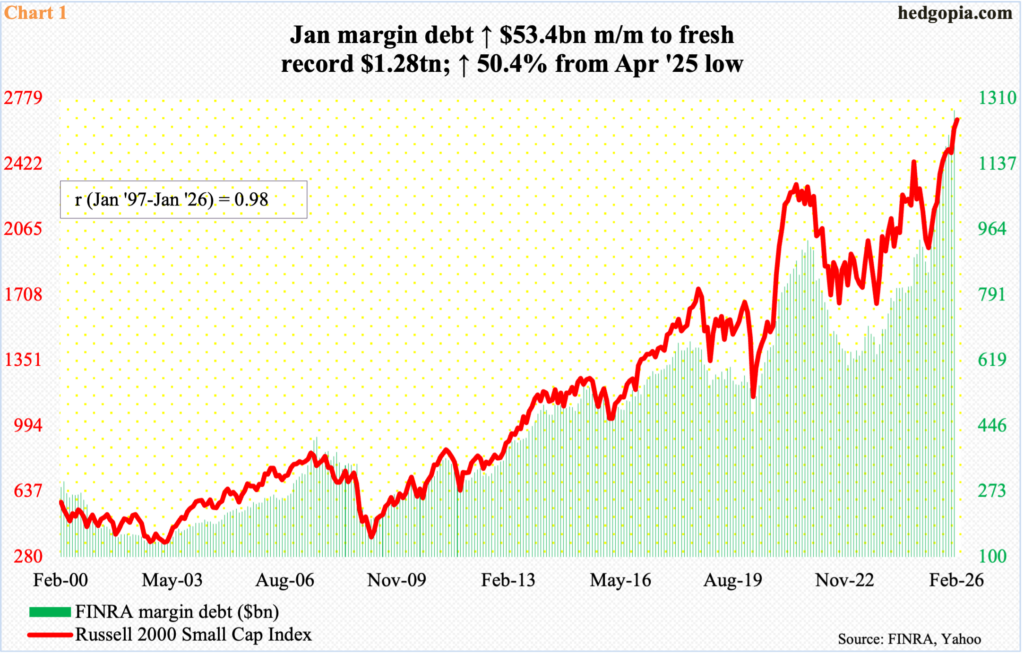
Margin debt set a new high in January, jumping $53.4 billion month-over-month to $1.28 trillion. It has gone up every month since last May. From April’s low of $850.6 billion, margin debt has shot up 50.4 percent.
Margin debt has a positive correlation with the major equity indices. The Russell 2000 small cap index has a slightly higher correlation versus large-cap indices such as the S&P 500 large cap index and the Nasdaq 100 index. Going back to January 1997, the correlation coefficient between the Russell 2000 and margin debt was 98 percent in January (Chart 1).
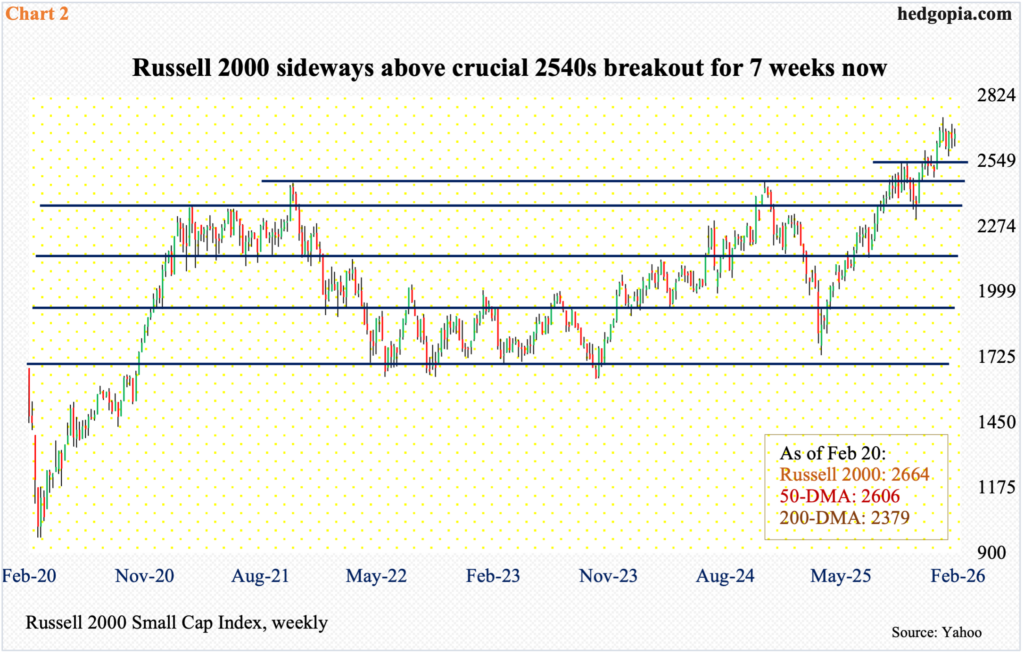
In January, the Russell 2000 reached a new intraday high of 2735 on the 22nd, but only to then finish with a weekly shooting star. Just a couple of weeks leading up to that, the small cap index had broken out of 2540s; the breakout was just about retested three weeks ago, with a low of 2569.
Last week, the Russell 2000 rallied 0.65 percent to 2664, with a high of 2687 on Wednesday. The prior week’s high of 2706 came within less than 29 points of its all-time high from last month. The index has nothing but gone sideways since the 2540s breakout (Chart 2).
Simplistically, the jump in margin debt last month helped the Russell 2000 score a new high, but the sideways movement since either means traders are using this as an opportunity to lock in gains or margin debt itself is showing early signs of going the other way. The latter would be the case if small-cap bulls fail to save 2540s; if this is followed by a breach of 2460s, then it is just a matter of time margin debt comes under serious downward pressure.
The sideways movement in small-caps comes at a time when large-caps have been doing exactly that, except much longer. In fact, both the S&P 500 and Nasdaq 100 have been consolidating around the highs of last October.
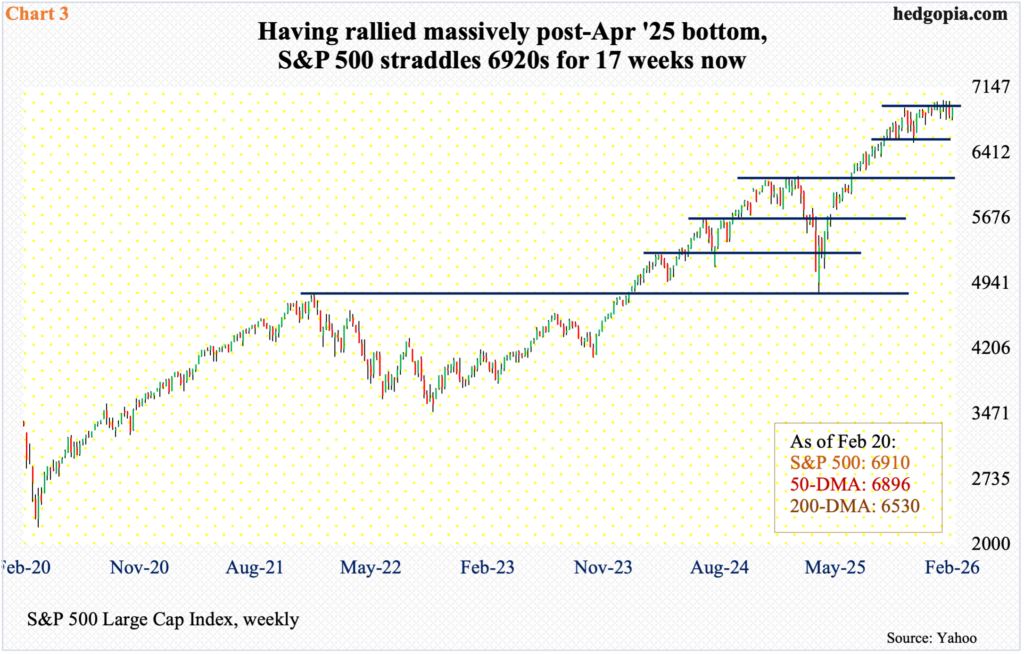
On 29 October, the S&P 500 ticked 6920, having rallied from the April bottom of 4835 (Chart 3). Last week, it rose 1.1 percent to 6910. In the intervening period, the large cap index rallied all the way to 7002, which was tagged on 28 January, but on several occasions before and after that, rally attempts stopped at 6990s, one of which occurred on the 11th this month. Trendline resistance from last month’s record, and touching this month’s high, extends to 6960. It is possible the S&P 500 rallies toward this in the near term, which would also mean 6920s gets reclaimed.
Mid- to long-term, however, longs will need to fight off the fatigue evident in how the index has traded the past four months. The monthly has produced interesting candles of late. January’s spinning top followed December’s spinning top and November’s hanging man. With five sessions to go, February is on course for a monthly doji.
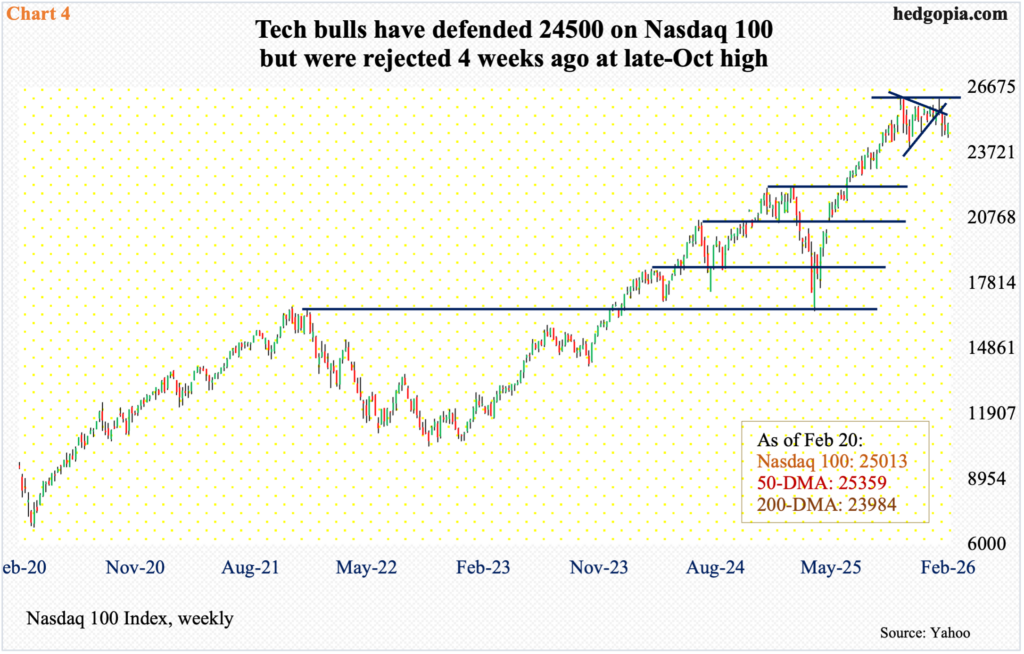
This is also the case with the Nasdaq 100, which surged 58 percent between the intraday low of 16542 on 9 April and the all-time high of 26182 on 29 October. On 28 January, the tech-heavy index came within 17 points of that high, before reversing lower (Chart 4).
Last week, the index increased 1.1 percent to 25013; until last Friday’s opening minutes, it was on its way to securing a fourth weekly loss, but bulls denied that. Nevertheless, lethargy is writ all over how the index has traded since late October.
Both January and December produced a monthly doji, which followed November’s hanging man. February is so far down 2.1 percent. A symmetrical triangle from the October high just broke to the downside three weeks ago.
Kudos to the bulls for not letting the bears take control of 24500 but right here and now they are fighting an uphill battle, with struggling momentum; the daily RSI, at 47, has been sub-50 throughout this month.
All in all, risk-on is evident in margin debt, but not how the large-cap indices are trading.
Thanks for reading!
