
With the 4Q earnings season nearly over, large-caps were in the black last year, while mid- and small-caps were in the red. The latter two have underperformed the large-caps from Oct ’22 lows but are running neck and neck from last year’s lows. The mid-caps are at a crucial juncture technically, and a breakout can help broaden the rally, which otherwise is narrow.
The fourth-quarter earnings season is just about over. As of last Tuesday, 92 percent of S&P 500 companies had reported their results, with blended estimates at $51.52, which is up 2.3 percent from a year ago but much lower than the consensus estimates at $57.38 when the December quarter began.
The picture is much worse for the mid- and small-caps.
Blended estimates for S&P 400 companies were $34.84. When the fourth quarter began, the sell-side was expecting $43.95. From a year ago, 4Q earnings are down 15.1 percent.
Fourth-quarter earnings are also down for S&P 600 companies, which saw the blended estimates drop 13.2 percent from a year ago to $14.99. When the December quarter began, the consensus stood at $21.94.
As the estimates progressively got lowered through the quarter, so was the bar for these companies to jump over.
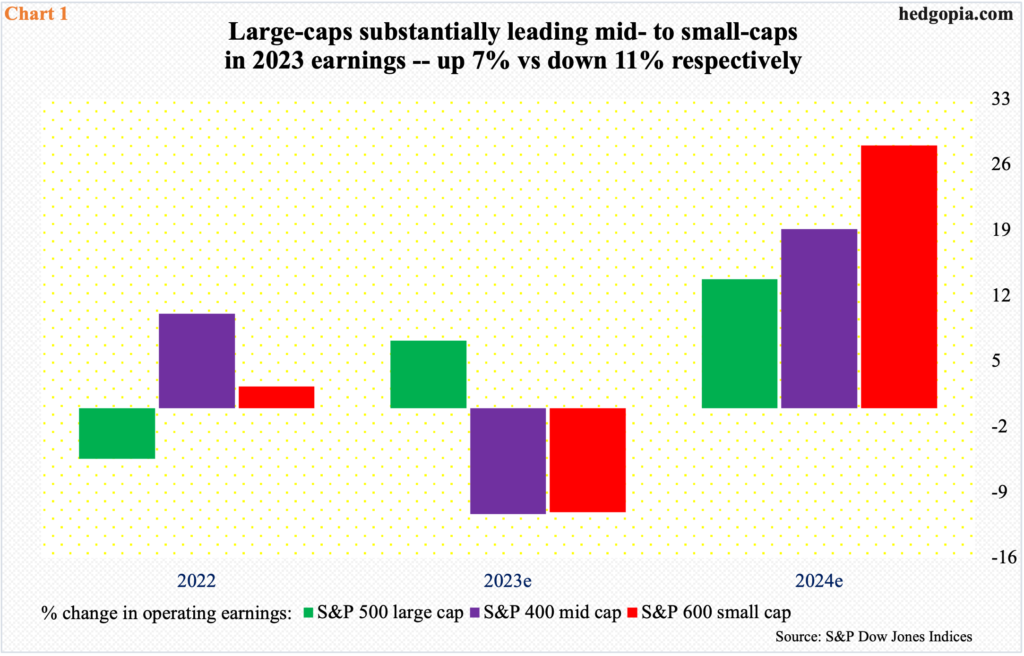
In the end, S&P 500 companies are on pace to earn $211.14 for the whole year, which will have registered growth of 7.2 percent. The mid- and small-caps are not so fortunate. The $150.20 in mid-cap earnings will be down 11.3 percent over 2022, while small-caps’ $67.50 will have dropped 11.1 percent (Chart 1).
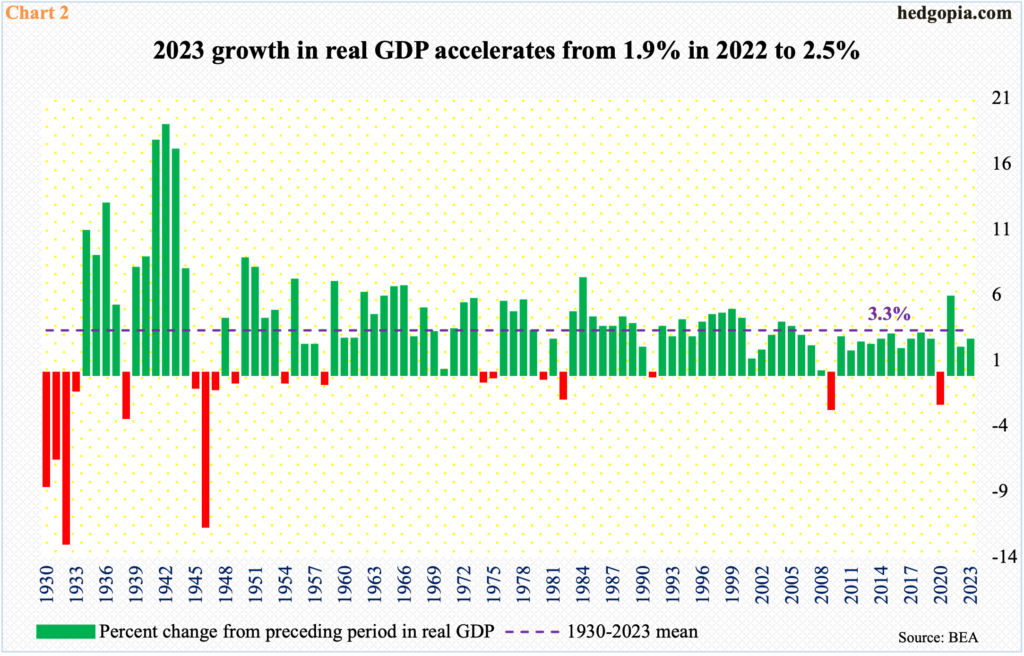
The irony in all this is that the mid- and small-caps are losing money in a year in which real GDP expanded 2.5 percent (Chart 2).
Interestingly, in 2022, when the economy grew 1.9 percent, the large-caps saw their earnings decrease 5.4 percent, even as the mid- and small-caps saw theirs increase 10.1 percent and 2.3 percent, in that order (Chart 1).
Not surprisingly, the sell-side has high expectations for 2024, as large-, mid- and small-cap earnings are expected to surge 13.8 percent, 19.1 percent and 28.1 percent respectively. Customarily, these analysts start out the year with a lot of optimism and bring out the scissors as the year goes on.
For 2023, for instance, S&P 500 companies in April 2022 were expected to ring up $250.12. Similarly, in May 2022, S&P 400 companies were penciled in to bring home $207.54, while S&P 600 estimates in June 2022 were $111.23!
If anything, this year’s estimates should be taken with a grain of salt.
Earnings mediocrity last year in part explains why the mid- and small-caps have underperformed the large-caps from the lows of 2022.
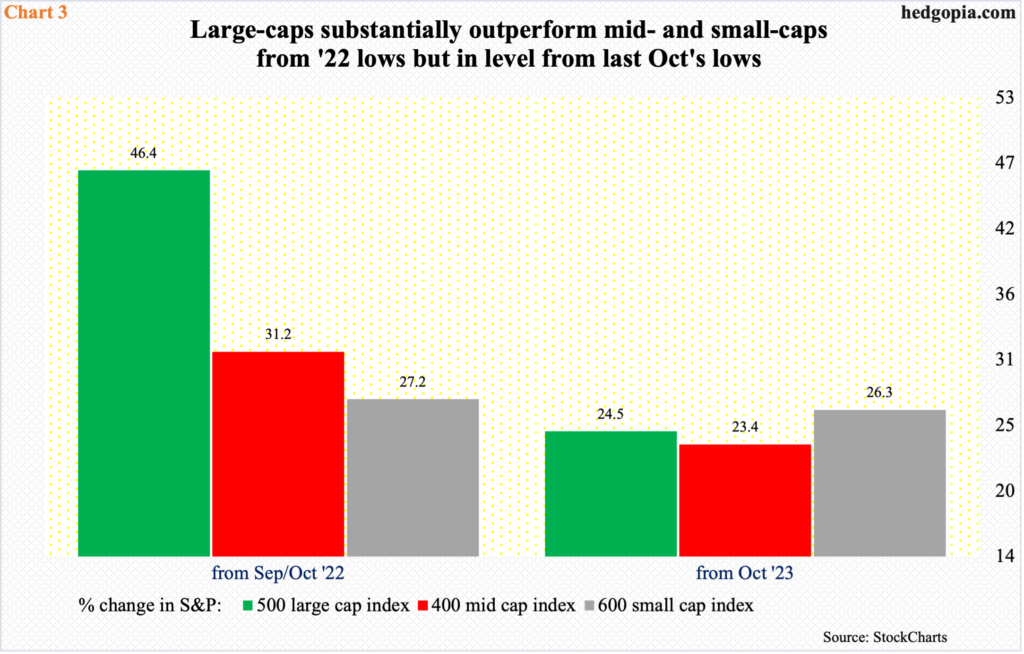
Back then, the S&P 500 bottomed at 3492 in October. Last Friday, the large cap index tagged 5111 – for a rally of 46.4 percent over 16 short months. In 2022, both the mid- and small-caps bottomed in September – respectively at 2186 and 1058. Last Friday, the mid-caps tagged 2867, while the small-caps reached 1345 late December. From the September 2022 lows, the mid- and small caps rallied 31.2 percent and 27.2 percent, in that order (Chart 3).
While the mid- and small-caps underperformed their large-cap cousins, they are however running neck and neck from the lows of last year. From last October, the large-, mid- and small-caps are respectively up 24.5 percent, 23.4 percent and 26.3 percent.
One constant knock against the rally the last several months has been that it is too narrow – which is true. Indeed, the generals – just a handful and all tech, by the way – are leading by a mile and the soldiers are falling behind. The mid- and small-cap performance since last October is a sign they are trying to catch up.
The S&P 400 mid cap index, as a matter of fact, is staring right into a great opportunity. We shall see if the bulls can deliver.
Both the S&P 400 and 600 peaked in November 2021, as did the Nasdaq 100. The S&P 500 did not peak until January the following year.
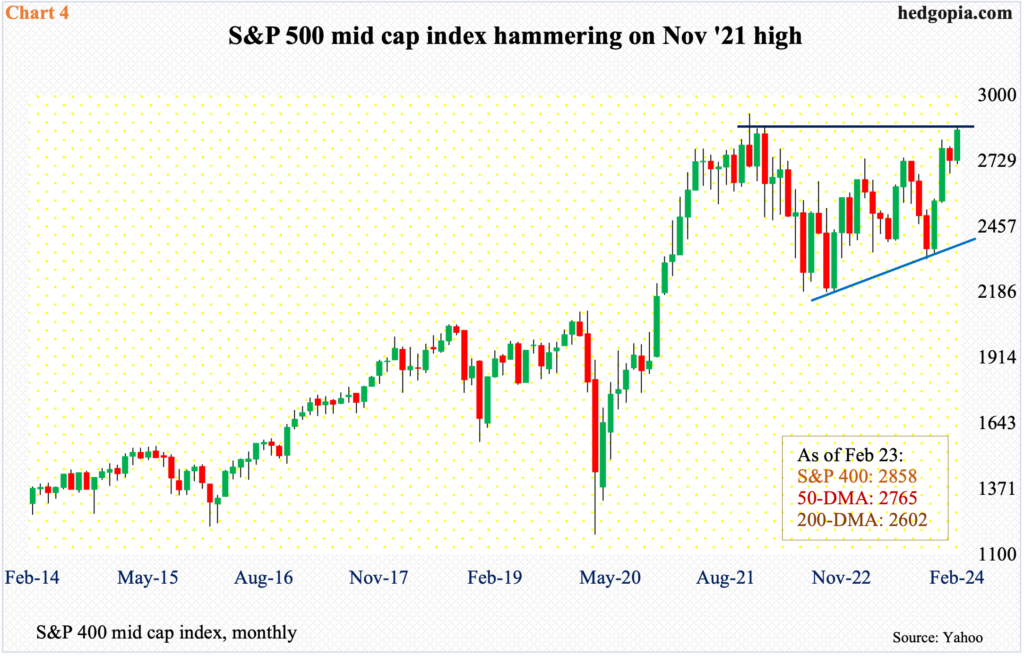
The S&P 400 tagged 2926 back then and retreated, leaving behind a long upper wick on the monthly candle. It subsequently reached 2187 in June 2022 and rallied; that low was once again tested come September with a low of 2186. Last October, the index reached a higher low of 2322. Since that low, it rallied in November and December and is up 4.6 percent February-to-date, with a down January. (Incidentally, the S&P 600 has performed similarly, with three up months and a down January, but the S&P 500 is up in all four.)
Last Friday’s close of 2858 brings the S&P 600 mid cap index within less than 60 points of the November 2021 high (Chart 4). A breakout – should one occur – will carry importance, as this can help broaden participation in the otherwise-concentrated rally.
Thanks for reading!
