
- Having lagged large-caps since March, small-caps have very weak technical underpinnings, and are getting close to a make-or-break level. Non-commercial futures traders have astutely taken advantage of the decline. Watch what they do.
 It has been a while this blog has had a bearish bias on small-caps. The Russell 2000 Small Cap Index is truly taking it on the chin – down four percent year-to-date, versus the Nasdaq Composite which is up eight percent and the S&P 500 Large Cap Index which is up seven percent. In recent days, trader talk has revolved around a bearish technical formation known as death cross, which gets triggered when the 50-day moving average crosses below 200-day. The RUT experienced one the other day. Bears prognosticate that this is an indication of big trouble ahead for the broad market. Bulls brush it off, saying this is nothing more than voodoo. First of all, such formations are no fail-proof. Technical analysis is more like an art than a science. Most of the time, by the time a death cross is triggered, a stock would have already fallen a decent amount. In our example, off its early-July highs, the RUT is already down eight percent. Short-term technicals are grossly oversold, raising the possibility of a reflex rally. Secondly, going back 10 years, there have been six 50/200 crossovers on the RUT – June 2005 (no decline post-crossover), July 2006 (slight decline), September 2007 (big decline), October 2008 (big decline), August 2010 (slight decline), August 2011 (big decline). Three out of the six times, the index proceeded to drop significantly. This is not something one can simply pooh-pooh and move on. (In July 2012, the index came very close to triggering a crossover, but turned up on time.)
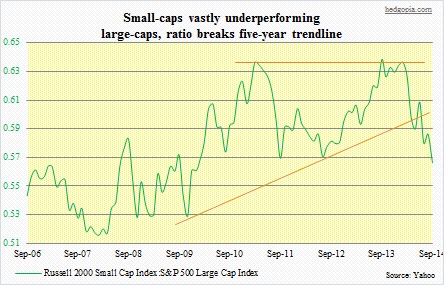
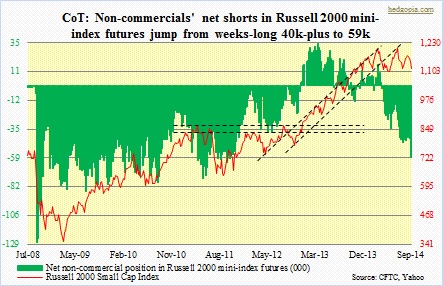 The issue at hand is not so much if the crossover would end up setting off a sell-fulfilling prophecy, rather if investors step in to save some crucial support underneath. On the IWM, the first line of support is at 110, followed by a must-hold 108. In the adjacent chart, the latter support is not visible as the chart uses closing price, not intra-day. The way things are looking now, it is just a matter of time before these levels are tested. In the current environment, there is not much love for small-caps. Plain and simple. Just look at the chart above. They have been lagging their larger brethren since early March. Rather ominously, that was also the beginning of what looks like a double top formation. Even worse, the ratio has sliced through a five-year trendline. Several monthly indicators continue to point toward continued weakness ahead. If there is a breakdown – meaning the support in question gets violated – then we know things are going to get ugly. But here is the thing. By the time the ETF gets to 108, it would have already dropped north of 10 percent. Under-performing managers might just decide to take a swipe at it, thinking seasonality might favor a long bias. You never know. So there is hope for the bulls. We will see how it unfolds. For now, the trend is to the downside, and will remain that way until stopped. Large speculators, who have played small-cap weakness like a fiddle, did it again. Last week (by Tuesday), their net shorts in Russell 2000 surged to 59k, up from the 40k-plus level of the previous nine weeks. The aggression has paid off, with the index down two and a half percent so far in the week.
