Today is jobs day. April numbers are due out later this morning. One of the metrics that economists keenly await is average hourly earnings for private-sector employees.
The U.S. unemployment rate has dropped all the way to five percent – from 10 percent in October 2009 – although this is not entirely due to a tight labor market. There are factors such as unemployed moving out of the labor force. The ‘not in labor force’ category has risen from 80.9 million in June 2009 to 93.5 million in March this year.
That said, the unemployment rate is probably low enough to exert upward pressure on wages, and that is yet to happen. Along with low productivity and subdued economic growth, lack of sustained wage gains is a head-scratcher in the current cycle.
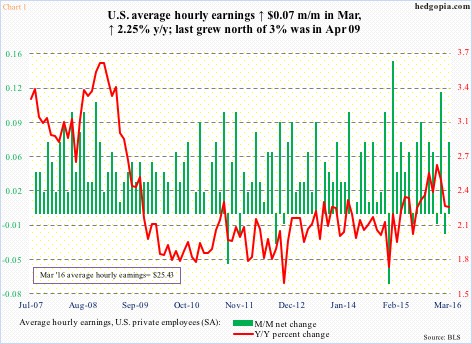
In March, average hourly earnings of private-sector employees were $25.43, up $0.07 month-over-month, and up 2.25 percent year-over-year. Y/Y growth has been decelerating since 2.64 percent last December. The last time earnings grew with a three handle was in October 2009 (Chart 1).
Consequently, relationships that in the past firmly held have broken down.
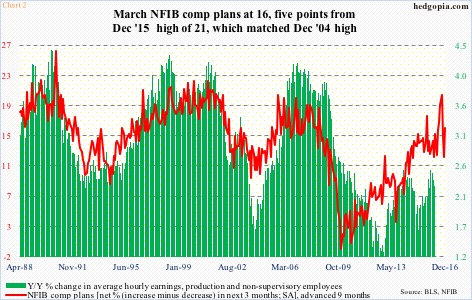
In Chart 2, y/y percent change in average hourly earnings of private-sector production and non-supervisory employees has been plotted against National Federation of Independent Business (NFIB) comp plans. The latter is advanced by nine months. A couple of things jump right out in the chart.
First, versus prior cycles, the green bars are much shorter this time around. Earnings are yet to grow three percent in the current cycle. The last time this occurred was in May 2009. Secondly, the red line and the green bars have diverged, with the latter in decline since 2.6 percent growth last December.
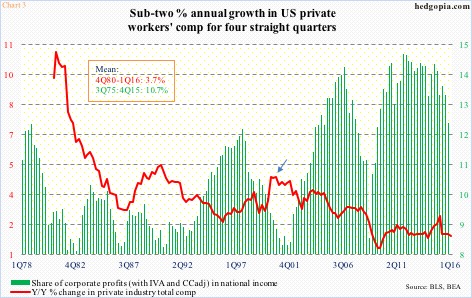
Looking at both Charts 1 and 2, the lack of wage gains looks cyclical in nature. Chart 3 tells us it may be more than that.
Private-sector total comp grew at 4.7 percent annually in 3Q00 and has been in decline since (arrow in Chart 3). The current cycle peaked at 2.8 percent in 1Q15, with the last four quarters sub-two percent.
The irony is, the red line in Chart 3 is much weaker versus history, even as the green bars are much stronger versus the historical average. The latter is essentially corporate margins, which at 12.2 percent in 4Q15, has been under gradual pressure the past four years. Corporates’ share of profits is dropping not because they are doling out more in wages and benefits.
Therein lies the problem. In the current cycle, U.S. corporations have enjoyed a buyer’s market when it comes to employee comp. As a result, wages remained low even as margins were at/near record highs. Now that the latter is dropping, corporations will do their best to maintain the status quo.
Thanks for reading!

