
The Nasdaq 100 index does not act well. Is it purely rotation or a reflection on the economy or on the 1Q17 earnings season that begins next week?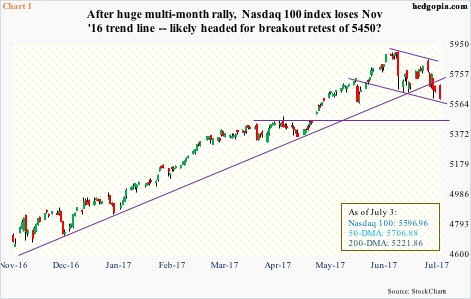
After rallying for seven consecutive months, the index lost 2.5 percent in June, massively underperforming major U.S. peers. The S&P 500 large cap index was up 0.5 percent in June, the Dow Industrials rallied 1.6 percent, while the Russell 2000 small cap index jumped 3.3 percent.
July has not started off any better, with the Nasdaq 100 down 0.9 percent Monday. The tech-heavy index is below the 50-day moving average as well as below a trend line from November last year (Chart 1).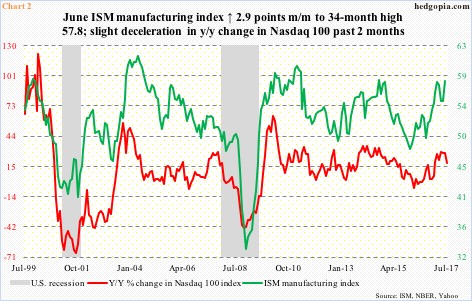
The Nasdaq 100 peaked on June 9 at 5897.69 – a new record. Using that figure, the index would have been up 33.5 percent year-over-year in June. But it closed out the month at 5646.92, up 27.8 percent on a closing basis. April was up 28.6 percent y/y, and May up 28 percent. There has been slight deceleration.
In fact, if July at least closes at the Monday close of 5596.96, the index would only be up 18.3 percent y/y in the month. This deceleration is seen in Chart 2, which pits the ISM manufacturing index with y/y percent change in the Nasdaq 100.
The two track each other pretty well.
ISM manufacturing rose to a 34-month high in June, up 2.9 points month-over-month to 57.8. Manufacturing activity went up 8.4 points in the past 10 months – from 49.4 last August – and is at/near the top end of the range. As is natural with this series, a breather makes sense.
The Nasdaq 100 could very well be anticipating this.
Rather interestingly, the 1Q17 earnings season begins in earnest next week, and the bulls were unwilling/unable to defend the 50-day. The top-five weights – a combined 42 percent – have lost the average as well.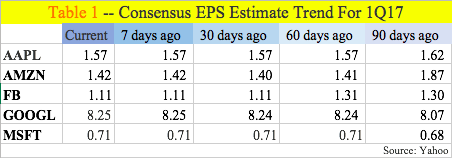
AAPL (Apple; 11.9 percent weight) has traded under the 50-day for three weeks now. GOOGL (Alphabet; 9.2 percent) and MSFT (Microsoft; 8.3 percent) lost it last week, and AMZN (Amazon; seven percent) and FB (Facebook; 5.5 percent) on Monday.
The tech rally particularly this year has been top-heavy. Thus, as go the top-five (or the top-10), so goes the index.
For three of the five, current 1Q17 estimates are lower versus 90 days ago – AAPL, AMZN and FB. The bar is lower. Consensus estimates for GOOGL and MSFT have gone up, but not a whole lot (Table 1).
Yet, the Nasdaq 100 is acting as if it expects a tough earnings season.
Monday, it closed right on the daily lower Bollinger band. It is also at the lower end of a short-term channel (Chart 1). The daily chart is beginning to look oversold. This is yet another opportunity for the bulls to step up and try to repair the damage wrought on the index. A failure exposes it to breakout retest of 5450 – a must-hold.
Thanks for reading! Please share.
