Stocks have rallied huge since last October’s lows. Breadth, however, has been a problem. Large-caps are outperforming, and even here, just a handful are leading the way. Mid- and small-caps are lagging. Amidst this bifurcation, mid-caps have now rallied within just a jump away from their November 2021 peak. Small-caps are a ways off from their peak from that time and are unlikely to join their large- and mid-cap cousins.

The Nasdaq 100 is going gangbusters. With two months and a session in, it is already up 8.8 percent this year. From last October’s lows, it is up 30.4 percent – and 75.6 percent from the lows of October 2022!
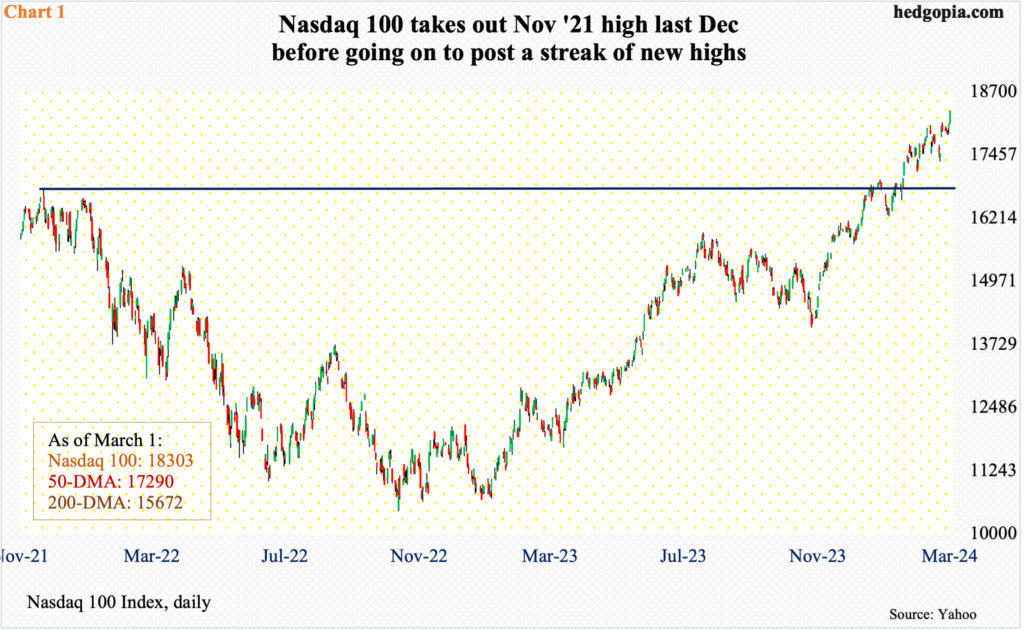
Of the major US equity indices, the tech-heavy index is the first one to eclipse its prior high (Chart 1). In November 2021, it peaked at 16765, before tumbling 37.7 percent by October 2022. That high from two-plus years ago was taken out last December. (The 30-stock Dow Industrials also reached a new high last December.)
The Nasdaq 100 has not looked back since. A new intraday high of 18333 was hit last Friday, with a close of 18303. Since February 9th, rally attempts persistently stopped at 18000, which has now given way. The index acts like it wants higher prints.

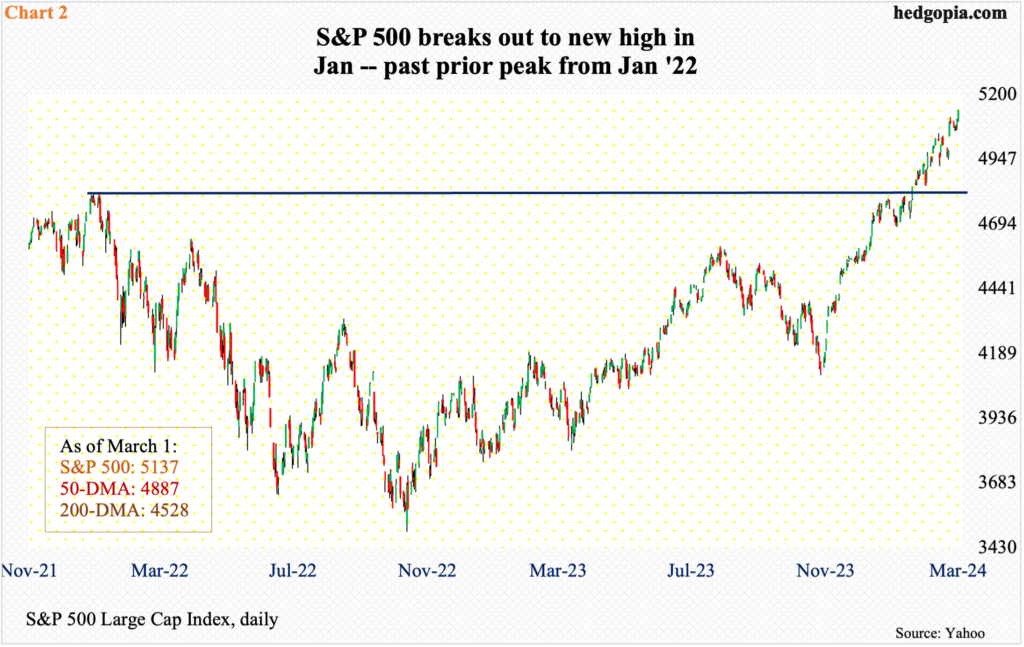
The S&P 500 joined the Nasdaq 100 this January. Two years before that, the large cap index peaked at 4819 in January 2022, subsequently losing 27.5 percent through October that year. From that low, it has now rallied 47.1 percent.
Last Friday, the S&P 500 tagged 5140 intraday, closing at 5137. These are new highs. The January 2022 high was surpassed in January this year (Chart 2), and the momentum has continued. As was the case with the Nasdaq 100 last Friday, the S&P 500 enjoyed a mini breakout.
The rally off last October’s lows in particular is like no other. Up in 16 of the last 18 weeks – ditto with the Nasdaq 100 – the S&P 500 remains in gross overbought territory but is yet to show serious distribution.

One constant knock against the rally in large-cap indices such as the Nasdaq 100 is that it lacks wide participation. Indeed, the index remains top-heavy. Within it, the top five – Microsoft (MSFT), Apple (AAPL), Nvidia (NVDA), Amazon (AMZN) and Google owner Alphabet (GOOG) – command 32.7 percent. Within the S&P 500, the top five’s share is 25.6 percent.
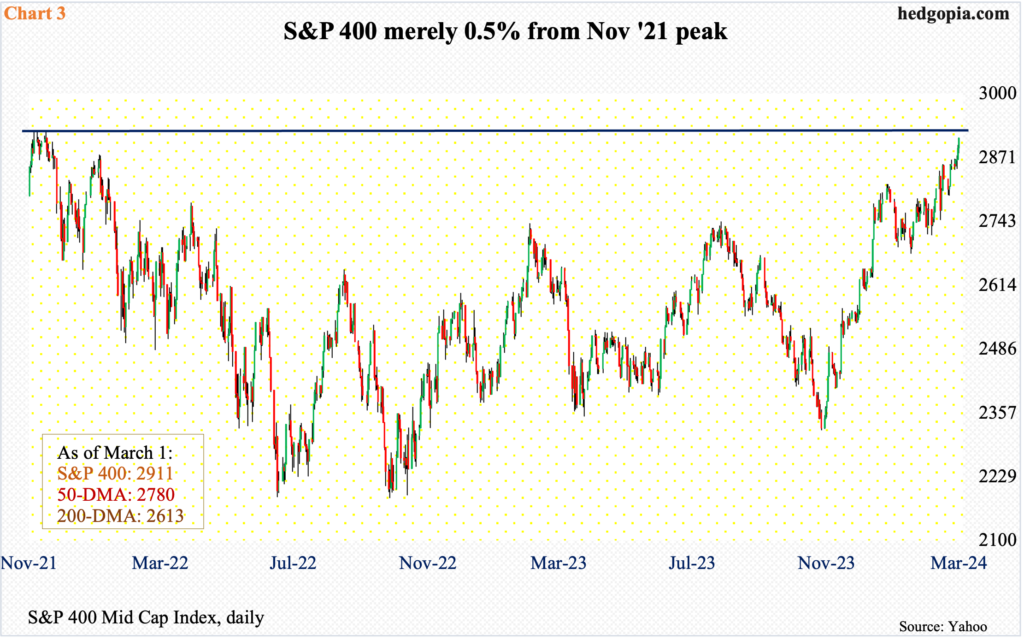
As large-caps dominate the action, mid- and small-caps are falling behind. But there is hope for the bulls. This has been slow in coming, but the S&P 400 is within earshot of a new high. The mid cap index peaked in November 2021 at 2926. From that high through the low of 2186 posted in September 2022, it dropped 25.3 percent. From that low, it is now up 33.2 percent.
Last Friday, the S&P 400 rallied 0.7 percent to close at 2911, merely 15 points from the November 2021 high (Chart 3). A breakout here would finally result in both large- and mid-caps with new highs.

Equity bulls are hoping that this then spreads to the small-cap land. For that to happen, however, serious effort is needed.
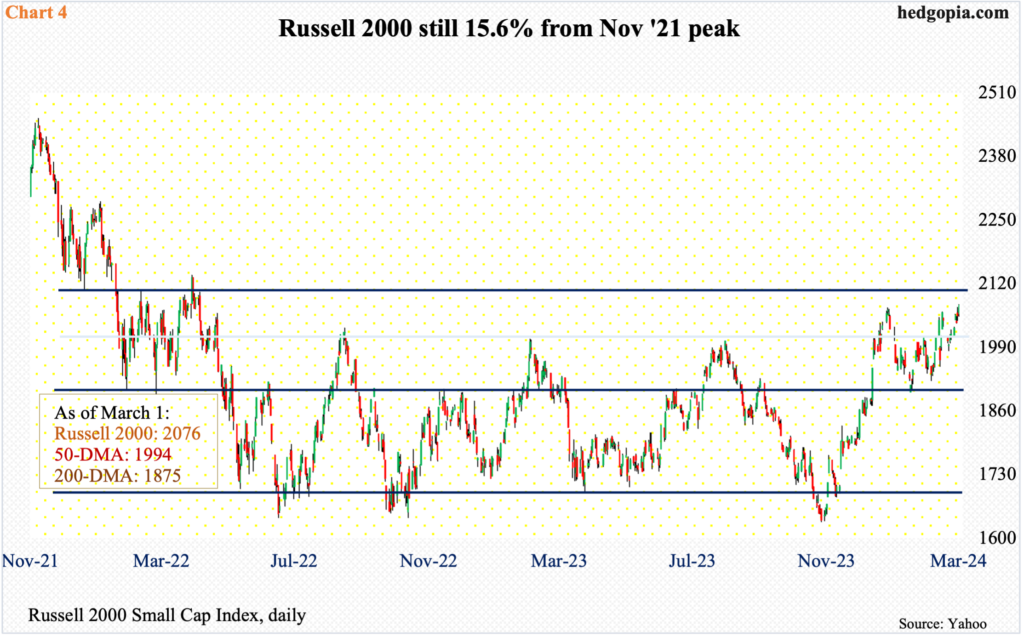
The Russell 2000 is 15.6 percent from its November 2021 high. Back then, it peaked at 2459 and then dropped to 1641 by June the following year, down 33.2 percent. That low was tested in October that year (1642) and last October (1634). From the October 2023 low through December’s 2072, it then rallied 26.8 percent. Last Friday, the December high was tested, with a session high of 2078 and a close of 2076.
In the sessions ahead, there is a decent chance the Russell 2000 proceeds to at least test 2100, which is a measured-move target following a 200-point range breakout at 1900 on December 13th (Chart 4). Even in this scenario, the index is too far away from testing its all-time high from more than two years ago.
This is important considering that the overall investing environment already reeks of giddy exuberance. As things stand, even if the mid-caps succeed in rising to new highs, small-caps remain a suspect.
Thanks for reading!

