
U.S. tech stocks have come to life. The Nasdaq composite (5213.14) is within spitting distance of its all-time high 5231.94 of July last year. On a weekly closing basis, last week was a new record.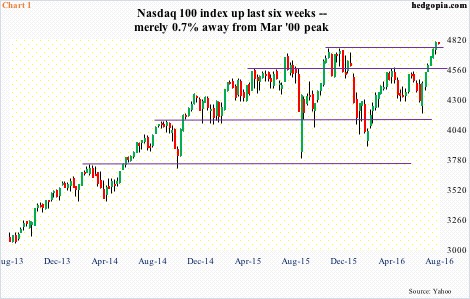
The Nasdaq 100 index (4784.74) is a mere 0.5 percent from its March 2000 all-time high of 4816.35. Up for six straight weeks, it first took care of April 2015 horizontal line resistance, followed by one last week. The latter resistance goes back to November last year (Chart 1).
Second-quarter results from Apple (AAPL), Amazon (AMZN), Facebook (FB), Alphabet (GOOGL), Microsoft (MSFT), Texas Instruments (TXN) and several others were received well. Leading up to earnings, the bar was continuously pushed lower – in most cases, anyway – so this helped build/add to momentum.
But is the rally merely driven by momentum and technicals, or is there something else going on with respect to fundamentals?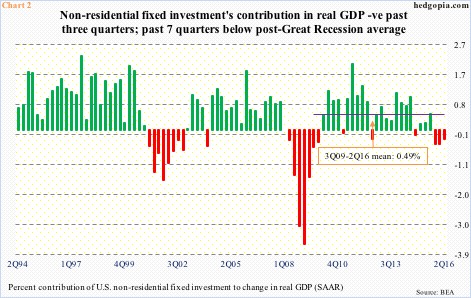
Chart 2 plots non-residential fixed investment’s contribution to change in real GDP. In 2Q16, it subtracted 0.28 percent from growth. Real GDP grew 1.2 percent in that quarter. This was the third successive quarter non-residential fixed investment’s contribution was in the negative column.
Investment spending (real) peaked at a seasonally adjusted annual rate of $2.22 trillion in 3Q15, and by 2Q16 had declined to $2.17 trillion – an eight-quarter low. Equipment investment also peaked in 3Q15 at $1.09 trillion, and stood at $1.04 trillion in 2Q16. Intellectual property products were at a new high $703.2 billon in 2Q16.
The point is, capital expenditures remain subdued, and have been that way for a while.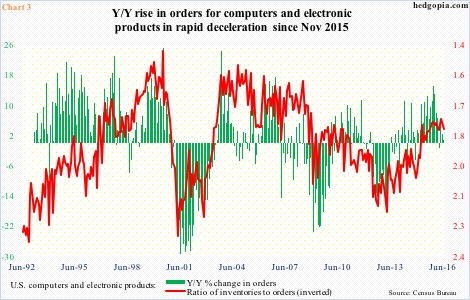
Orders for non-defense capital goods ex-aircraft – proxy for business capex – dropped 3.6 percent year-over-year to a seasonally adjusted annual rate of $62.4 billion in June (not shown here). Orders peaked at $70.7 billion in September 2014. June was the eighth straight y/y drop and 17th out of last 18 months. The momentum is clearly down.
More specifically, orders for computers and electronic products inched up 0.7 percent y/y in June to a seasonally adjusted annual rate of $23.7 billion. As early as November last year, orders were growing at a 15-percent annual clip … quite a deceleration (Chart 3).
Chart 3 also plots a ratio of inventories to orders in computers and electronic products, which rose to as high as 2.19 in March 2013, before heading lower. That said, the red line ticked up from 1.76 in April to 1.8 in June, and it seems momentum is in the midst of a shift.
The culprit remains end-demand.
Shipments for computers and electronic products have essentially gone sideways for 11 months, with June at a seasonally adjusted annual rate of $26.5 billion.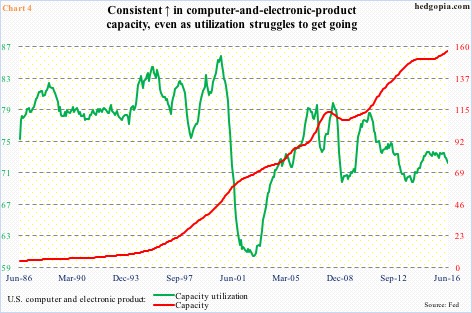
This does not help push up utilization especially when capacity is persistently increasing. Chart 4 plots capacity with utilization in computers and electronic products, and it is not a good combo – the former rising and the latter dropping. In June, utilization dropped to 72.2 percent – the lowest since August 2014. As a matter of fact, since utilization peaked at 85.8 percent in July 2000, it has persistently made lower highs. In the meantime, capacity is at a new high.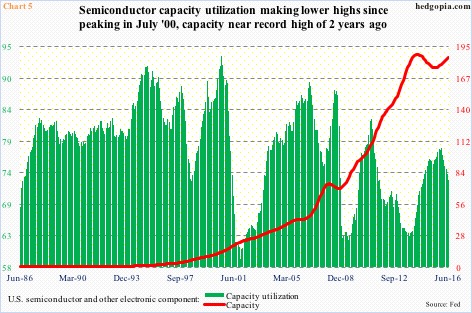
Over in semiconductors, similar dynamics are in play. The green line in Chart 5 peaked at 93.4 percent in July 2000, with persistently lower highs since. Utilization was 72.6 percent in June. Capacity peaked in April 2014, and has been rising since last August. June (this year) is a hair’s breadth away from the peak two years ago.
There is a clear mismatch between capacity and utilization, not to mention between shipments and orders.
In the aggregate, the fundamental side of the tech story is full of holes. This is not what is behind the tech rally. Momentum only goes so far. Enjoy while it lasts.
Thanks for reading!
