
Equities stumble out of the 2024 blocks. In the final sessions of December, the major US indices had either just broken out to new highs or were close to doing that. It remains to be seen if the weakness since late December is just a short-term unwinding of the overbought conditions that had built up or the beginning of a sustained drop. How things evolve at breakout retest will be telling.
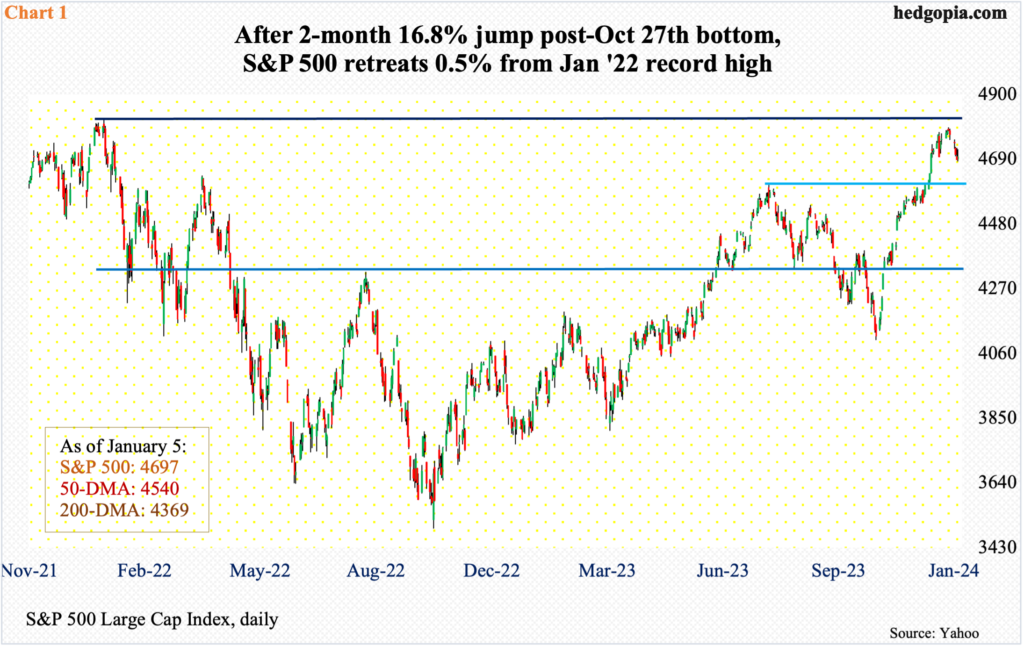
Between the October 27th low and the high on December 28th, the S&P 500 shot up 16.8 percent to 4793. But for those that bought at the peak in January 2022, this was just about enough to break even. The large cap index peaked back then at 4819, before tumbling 27.5 percent by October that year to 3492. The rally that followed stopped last July at 4607, with the index then proceeding to drop 10.9 percent to last October’s 4104 trough.
So, in essence, the S&P 500 went nowhere in a couple of years, with a lot of vacillations in between. At the late-December high, the index was merely 0.5 percent from the January 2022 peak. The bulls could not quite pull it off – a fresh high, that is (Chart 1). Sellers began to show up in the final two sessions last year and it continued in the new year.
The index gave back 1.5 percent last week to 4697. The July 2023 high was taken out a session before the December 12-13 FOMC meeting began. Come the 13th, the policy-setting body made a dovish turn, contributing further upward pressure to risk-on assets including equities. This is going to be an important retest in the sessions ahead. Just underneath at 4540 lies the rising 50-day; the index has remained above the average since November 3rd.
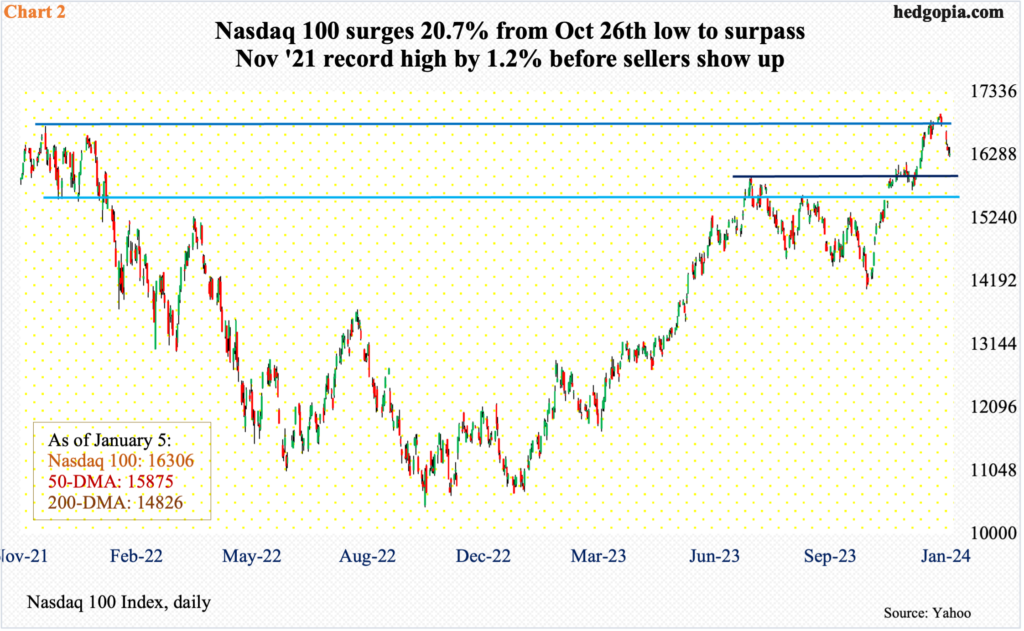
Unlike in the S&P 500, tech bulls were able to score a new high in the Nasdaq 100. But no sooner did this happen than selling pressure intensified. The index tagged 16969 on December 28th – past the November 2021 peak of 16765. The week the newer high was made formed a weekly doji, followed by last week’s 3.1-percent decline.
This was preceded by a two-month, 20.7-percent surge from the October 26th trough, driving technical conditions into serious overbought territory. The weekly as a result has tons of room for unwinding of these conditions. The July high of 15932 is where a bull-bear duel is likely to occur (Chart 2).
More important in this regard is that the December-quarter earnings season begins later this week as financials get the ball rolling. The sell-side expects S&P 500 companies to earn $53.92 in operations, down from $57.38 when the quarter began. In other words, the bar customarily has been lowered ahead of reporting. Watch out for post-earnings weakness on better-than-expected results.
This also applies to the small-caps. S&P 600 companies are expected to bring home $19.29 in operations. At the start of the December quarter, the sell-side expected $21.94. Once again, the bar is low. This at a time when the Russell 2000 just scored a potentially important breakout. How investors react to last quarter’s earnings will decide if these indices are at least headed for a breakout retest or end up launching into another leg higher.
As things stand, small-cap bulls have a lot to prove in the weeks ahead. Kudos to them for having regrouped to break out of a nearly two-year range.
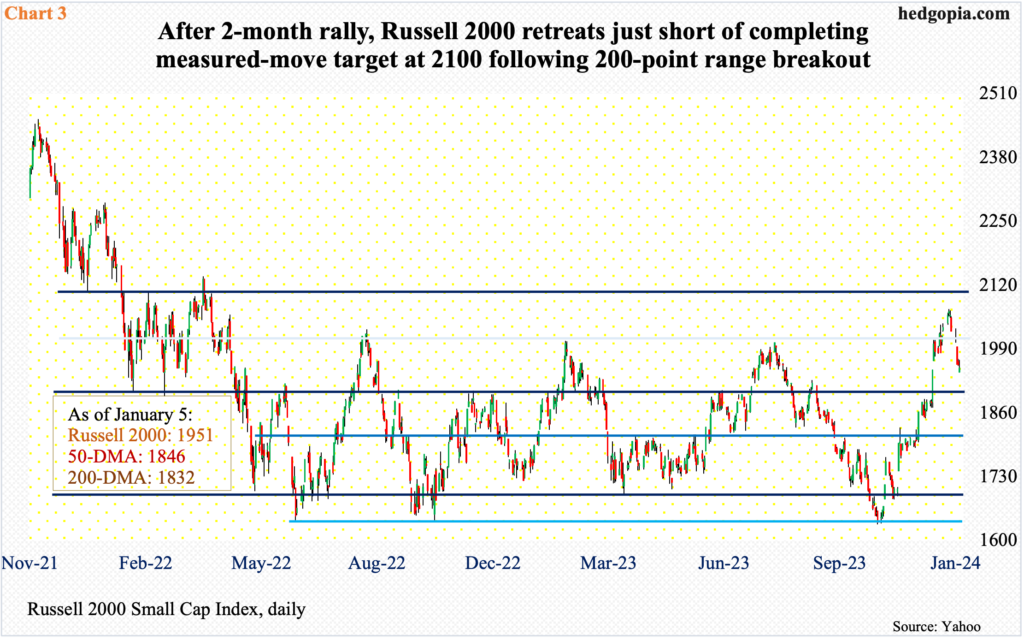
The Russell 2000 had been stuck in a 200-point range between 1900 and 1700 since January 2022. On the 13th last month – the FOMC decision day – it broke out (Chart 3). A measured move would put the target at 2100. The index tagged 2072 on the 27th last month, before selling pressure intensified, closing down 3.7 percent last week to 1951.
In due course, breakout retest at 1900 is the path of least resistance. Even after the November-December rally, the small cap index by the way was nowhere near its all-time high of 2459 reached in November 2021.
Thus far, the weakness post-December 27th high can be treated as orderly, as conditions had gotten too overbought. But the bulls cannot afford a breach of 1900. This would not only push the index back into the well-established range but also seriously question the excitement around the post-FOMC breakout.
Thanks for reading!
