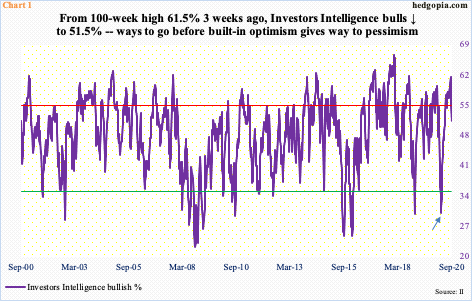
Investors Intelligence bulls are down three weeks in a row from 100-week high 61.5 percent to 51.5 percent. Sentiment remains in the optimistic zone. Importantly, this week’s rally attempts were just denied at the 50-day on the Nasdaq 100, which rallied nearly 84 percent in five and a half months.
With the decline in stocks the past three weeks, investor sentiment has taken a hit but the greed that built up for many weeks is nowhere near unwound.
This week, Investors Intelligence bulls retreated 3.4 percentage points week-over-week to 51.5 percent. This is the third w/w decline, having risen in the week to September 1 to 61.5 percent, which was the highest since October 2018 (Chart 1).
Bears were 19.4 percent this week, up from 16.2 percent two weeks ago. For reference, in the week to March 24 when US stocks were bottoming, bears were 41.7 percent and bulls 30.1 percent (arrow).
In the right circumstances for the bears, sentiment has a long way to go on the downside.
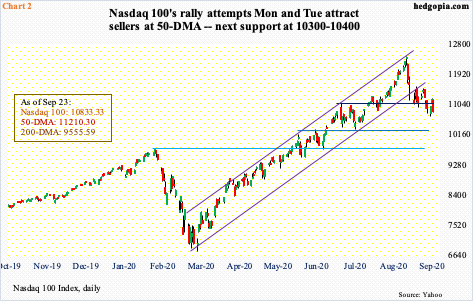
Major US equity indices have been under pressure since peaking on Sep 2. In this regard, a lot of the eyes are focused on how tech behaves, as the sector outperformed massively since the March lows. The Nasdaq 100 index shot up nearly 84%.
Before losing the 50-day last Thursday, the index went sideways around the average for several sessions. The breach of the 50-day preceded breakdown of a rising channel from March (Chart 2).
Early this week, tech bulls tried to put foot down. The Nasdaq 100 put together back-to-back positive sessions on Monday and Tuesday, with the latter session closing right on the 50-day. Wednesday, sellers came out of the woodwork in droves.
Inability to reclaim the average means bears will now be eyeing 10300-10400. From its September 2nd high, the Nasdaq 100 (10833.33) is down 12.9 percent. The 200-day will not be tested before it drops another 11.8 percent. Since the March low, the average has not been tested.
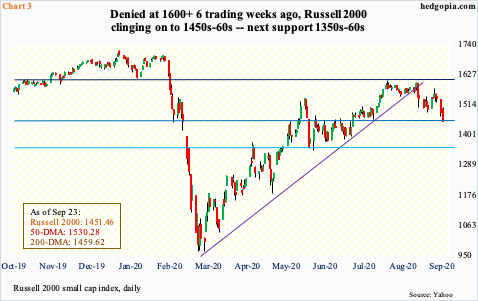
Tech’s outperformance leading up to this latest selloff can be gauged from the fact that the Russell 2000 (1451.46) lost its 200-day (1459.62) on Wednesday, albeit slightly. The small cap index already lost its 50-day at 1530.28.
Small-caps in general are considered risk-on, and they continue to lag. On August 11, the Russell 2000 printed 1603.60 and that was it. Resistance just north of 1600 goes back to January 2018. Wednesday, the index closed right on horizontal support at 1450s-60s. Breach risks are rising, and the next support zone lies at 1350s-60s.
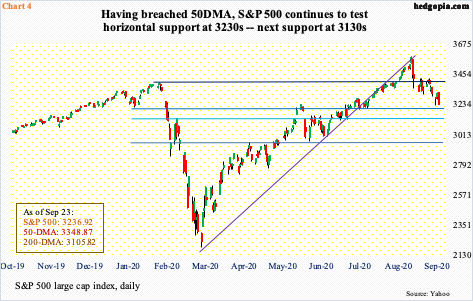
The S&P 500 large cap index, too, closed Wednesday right at 3230s straight-line support (Chart 4). As did the Nasdaq 100, the S&P 500 lost the 50-day last Thursday and is only 4.1 percent from the 200-day. A test of the average increasingly looks imminent, which will be the second time since the March low the average will have been tested.
In June, bulls defended the 200-day several times; later that month, as the average was being defended, a sharply rising 50-day nearly caught up. Now, the 50-day is flattish. Bulls’ inability to reclaim the average suggests momentum is shifting downward intermediate-term.
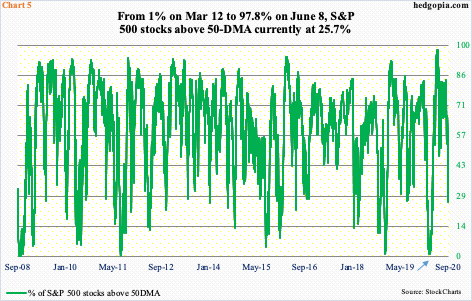
If the signals coming out of these indices – and others – bear out, then investor sentiment likely deteriorates before it gets better. In this scenario, metrics like the one highlighted in Chart 5 continue lower. In it, the percent of S&P 500 stocks above their 50-day is plotted, which on Wednesday stood at 25.7 percent.
During the February-March selloff, the metric dropped to 3.4 percent on February 28, popped to 26.1 on March 4, before coming under renewed pressure. On March 12, merely one percent were above their respective 50-day (arrow). On March 23, 1.2 percent were; the S&P 500 bottomed in that session. By June 8, this surged to 97.8 percent – from one extreme to the other. This elevated optimism is getting unwound, which is also the case with Investors Intelligence bulls’ count.
Thanks for reading!

