
The US dollar index, pretty much dancing to its own tune since peaking early this year, likely sits at a crucial level technically.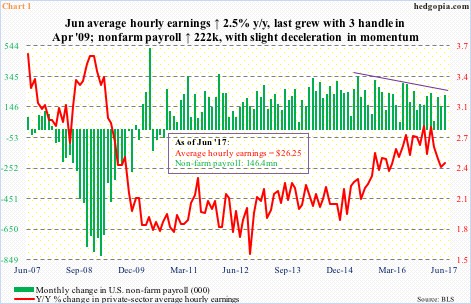
The U.S. economy added stronger-than-expected 222,000 non-farm jobs in June. Friday, the US dollar index pretty much treated this with a yawn, up 0.2 percent and unable to break free of the declining 10-day moving average.
It is possible traders focused on the lack of progress on the wages front. Private-sector average hourly earnings rose 2.46 percent year-over-year in June (Chart 1). The last time earnings grew with a three handle was in April 2009, when Great Recession was two months from ending.
Further, the first six months this year produced an average of 180,000 jobs, softer than a monthly average of 187,000 in 2016, 226,000 in 2015 and 250,000 in 2014. Momentum is gradually decelerating.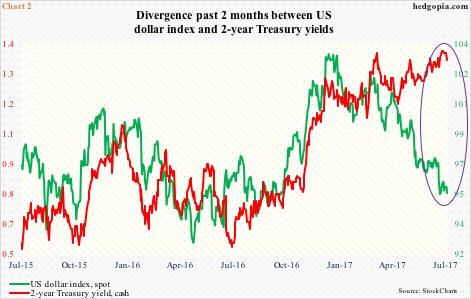
Most notably, the dollar index has diverged with two-year Treasury yields for the past four months (Chart 2).
Here is a brief background.
Leading up to December 2015 when the Fed hiked for the first time since July 2006, two-year yields – which tend to be sensitive to the Fed’s monetary policy – bottomed at 0.57 percent in October that year. Wednesday last week, they rose to 1.41 percent, before dropping to 1.37 percent yesterday. (Since December 2015, three have been three more 25-basis-point hikes, with the fed funds rate at 1.16 percent currently.)
Back then, the dollar index rallied north of 25 percent in nine months before peaking in March 2015 at 100.71. This proved to be an important price point – unsuccessfully tested in November/December 2015 and one which it falsely broke out of last November.
The consensus then was already overly bullish, yet one group of traders was not ready to jump on the bandwagon. This probably contributed to the dollar index’s inability to stage a breakout.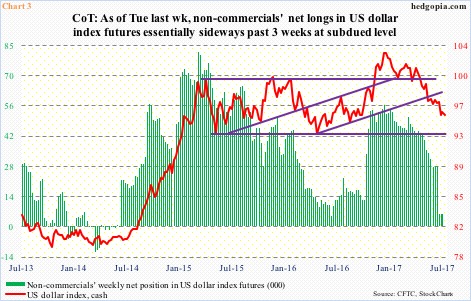
The peak in the cash in March 2015 coincided with a peak in non-commercials’ net longs in US dollar index futures. Their holdings went from 81,270 contracts to 4,692 in June last year. The subsequent buildup in net longs peaked last December at 56,712, which once again coincided with a peak in the cash (Chart 3).
As of last Tuesday, they held 5,836 contracts – pretty much flat the past three weeks. This time around, the consensus is dollar bearish. Non-commercials at least are not out-and-out bullish.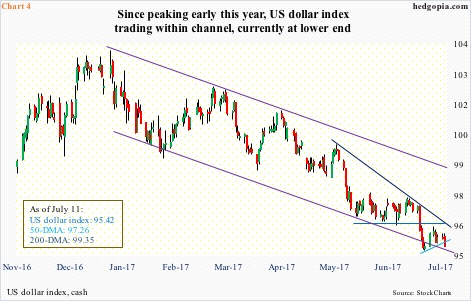
If this bearishness persists, the dollar index (95.42) in due course could very well be on its way to testing the lower end of a two-plus-year rectangle it is in (Chart 3). It lies just north of 93. This scenario could in particular result from an ECB that suddenly turns hawkish, likely putting upward pressure on the euro, which constitutes 57.6 percent of the dollar index.
Here is another scenario, which is beginning to look plausible.
The dollar index has been trading within a channel after retreating from a 15-year high early this year (Chart 4). It is testing the lower bound.
Both daily and weekly charts are grossly oversold, and bulls and bears are fighting a tug of war over control of shorter-term averages. The 10-day repelled rally attempts the past five sessions, while the 20-day approximates near-term resistance at 96.50-ish. If this level gets taken out, non-commercials’ holdings are worth a watch. If they turn and begin to add to net longs, the odds of a decent bottom in the dollar index would have grown significantly.
Thanks for reading! Please share.
