
Building on the crude theme a week ago, spot West Texas Intermediate crude did indeed break out of a declining trend line drawn from May 2015 (Chart 1). It rallied 3.3 percent for the week. For the last eight sessions, the spot traded right along its now sharply rising Bollinger band.
But last week’s rally in crude oil was no help to XLE, the SPDR energy ETF, and stocks in general.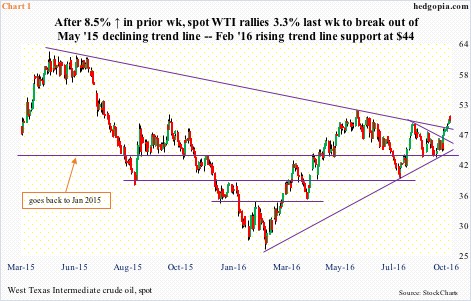
The question is, if the S&P 500 could not benefit from the crude tailwind last week, what happens when the latter comes under pressure? The odds of that happening near-term? Decent.
Interestingly, both crude and the dollar index rallied last week, with the latter up 1.3 percent. Because oil is priced in dollars, the two tend to move in opposite directions. But the dollar is not the only variable. There are others. Sentiment is one.
OPEC’s September 28th decision to commit to output cut to between 32.5 million barrels per day and 33 mb/d was received well by the markets. In August, the cartel produced 33.24 mb/d. This week was pretty much an extension of that sentiment. Plus, Hurricane Matthew helped. Ditto with inventory data released last week.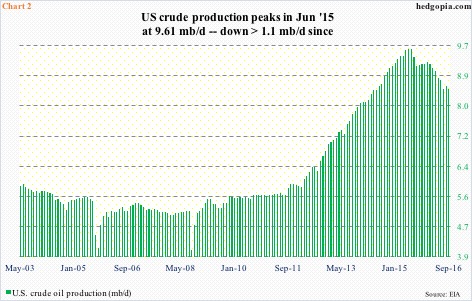
In the week ended September 30, U.S. crude stocks fell by three million barrels to 499.7 million barrels – the lowest since January 22 this year. Crude imports fell by 125,000 barrels per day to 7.7 million b/d. And crude production declined by 30,000 b/d to 8.47 mb/d. Production peaked at 9.61 mb/d in the June 5th week last year (Chart 2).
All this contributed to the breakout on the crude (Chart 1).
For oil bulls to really get excited, spot WTI needs to take out $51.67. That was the June 9th high. Resistance at $50-51 goes back to at least January last year. Further, back in January 2007, it dropped to $50.55 before going on a parabolic rise to $147.27 by July 2008. The $50-51 level is also where the the neckline of a reverse head-and-shoulders formation lies. A genuine breakout can have huge significance.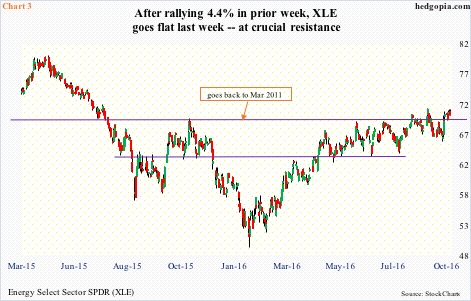
XLE probably does not anticipate this. It was absolutely flat last week, with the week producing a doji – second in three weeks and third in six. In the prior week, on the back of crude’s 8.5-percent jump, XLE rallied 4.4 percent to $70.61, which approximates an important price point for both bulls and bears going back to March 2011 (Chart 3). As things stand, this resistance stands, with daily momentum indicators way overbought. From trough to peak, it rallied 6.7 percent in the last nine sessions.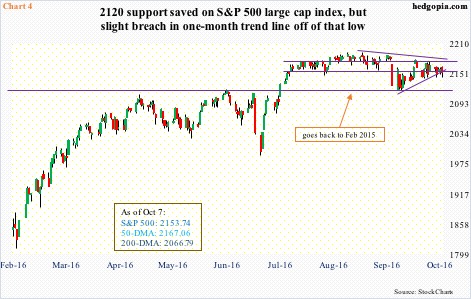
The story is similar on the S&P 500 large cap index. The 50-day moving average continues to drop – albeit ever so slightly – and resisted rally attempts in all five sessions last week. For now, the index remains range-bound – between 2175 and 2120. The latter is a must-hold.
Here is a consolation for the bulls. On September 9, when the S&P 500 (2153.74) sliced through the 50-day as well as lost 2160, there was an avalanche of sell orders. This is not happening now. But what if crude weakens further?
To date, the WTI breakout stands, but Friday’s action probably suggests fatigue. From the September 27th low through last Friday’s high, it rallied 14.8 percent … into heavy resistance. The spot is well above both 50- and 200-day moving averages. Both are still rising. But daily overbought conditions probably need to be unwound. The rising trend line from February this year will be tested around $44.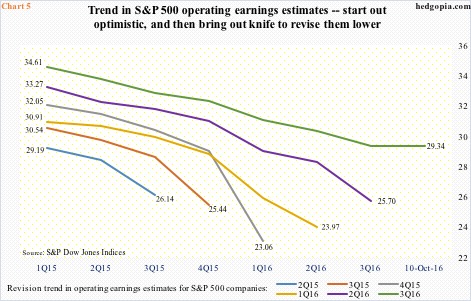
In this scenario, as far as the S&P 500 is concerned, crude oil headwind will be locking horns with earnings tailwind. Earnings season begins in earnest this week. As has been customary for the last several quarters, 3Q16 estimates have been persistently lowered (Chart 5).
Chart 5 plots revision trend in operating earnings of S&P 500 companies going back to 1Q15. In 2Q16, for instance, the quarter was expected to earn $33.27 in 1Q15, but when it was all said and done ended up only earning $25.70. In 3Q16, earnings are expected to come in at $29.34. At least going by five of the last six quarters, the S&P 500 rallied in the first month of the quarter, when the majority of earnings gets reported.
Near term, potential earnings tailwind is there, but this time around another variable has been thrown into the mix. Headwind can come from crude oil.
Thanks for reading!
