
Back in early August, China engineered a fall in the yuan. Soon followed investor hand-wringing over whether or not it would be selling its Treasury holdings in order to stabilize the currency. The Chinese economy is slowing, and capital outflows are rising.
When the People’s Bank of China reported August’s numbers, foreign exchange reserves had dropped by a record $93.9 billion, to $3.56 trillion. Reserves peaked at nearly $4 trillion in June 2014. Some 40 percent of China’s FX reserves are estimated to be held in Treasuries.
The obvious fear in the market is potential upward pressure on Treasury yields if China starts unloading its Treasury holdings. At $1.27 trillion, it is the largest holder of Treasury securities. Japan, at $1.2 trillion, is a close second. Together in August, they accounted for north of 40 percent of total foreign holdings of Treasury securities. China alone accounted for nearly 21 percent.
So what China does with its Treasury holdings – or Japan, for that matter – will have repercussions in the bond market.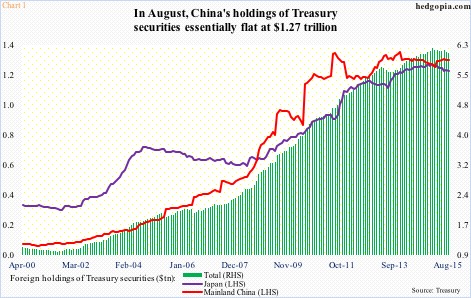
Turns out, despite yuan intervention, China did not cut back on its holdings in August. In fact, holdings went up a tad month-over-month – by $1.7 billion – to $1.27 trillion. They peaked at $1.32 trillion in November 2013, but have gone sideways the past four months (Chart 1).
On an aggregate level, foreign holdings of Treasury securities were $6.1 trillion in August, and have been slightly trending downward since $6.22 trillion in January this year (Chart 1). In August, net foreign purchases of U.S. Treasury bonds and notes were minus $35 billion – the second straight monthly reduction. On a 12-month rolling total basis, however, purchases were $41.1 billion (Chart 2).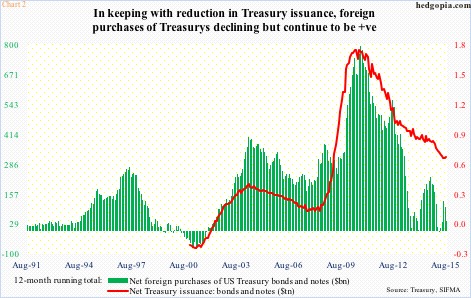
With that said, the green bars in Chart 2 have been trending lower. They peaked at just under $800 billion in August 2010. Net Treasury issuance was in the $1.7-trillion range back then, as the government was running high budget deficits. As deficits shrank, so did Treasury issuance, and the red line followed suit. Demand for Treasurys continues to be there. This is not a worry – at least now.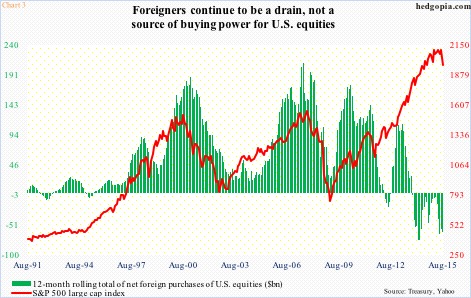
If someone is looking for things to worry about, there is plenty in Chart 3. The green bars represent a 12-month running total of net foreign purchases of U.S. equities. The last time they were positive was back in October 2013. The chart is as of September. The S&P 500 index is more than 100 points higher. So foreigners’ apathy toward U.S. stocks has not really mattered. In fact, the red line and the green bars began diverging more than two years ago. With that said, historically they have shown a tendency to move in tandem.
If the correlation between the two reasserts itself, then that would obviously be bad for stocks. More important perhaps is the fact that an important source of buying power is missing. This at a time when another hitherto-reliable source has been weakening.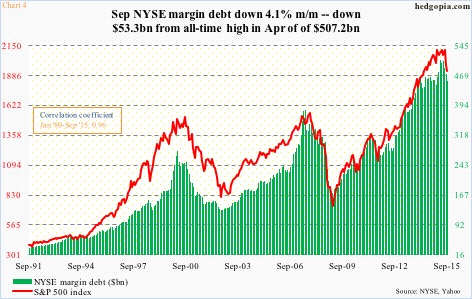
Margin debt declined further in September, down $19.5 billion, to $453.9 billion. Off the April all-time high of $507.2 billion, it is now down $53.3 billion. Once again, margin debt and the S&P 500 index tend to move in tandem. R is .96. So far this month, the S&P 500 (2052.51) is up 6.9 percent, so it is possible margin debt moved up as well. We would not know until three more weeks. It would be a worrisome sign if debt went down even as stocks rallied. Especially considering foreigners continue to be a drain, not a source of buying power.
Thanks for reading!
