The S&P 500 has dropped three weeks in a row. Santa Claus rally did not materialize this year, but the bulls just might get lucky as the year begins to wind down.

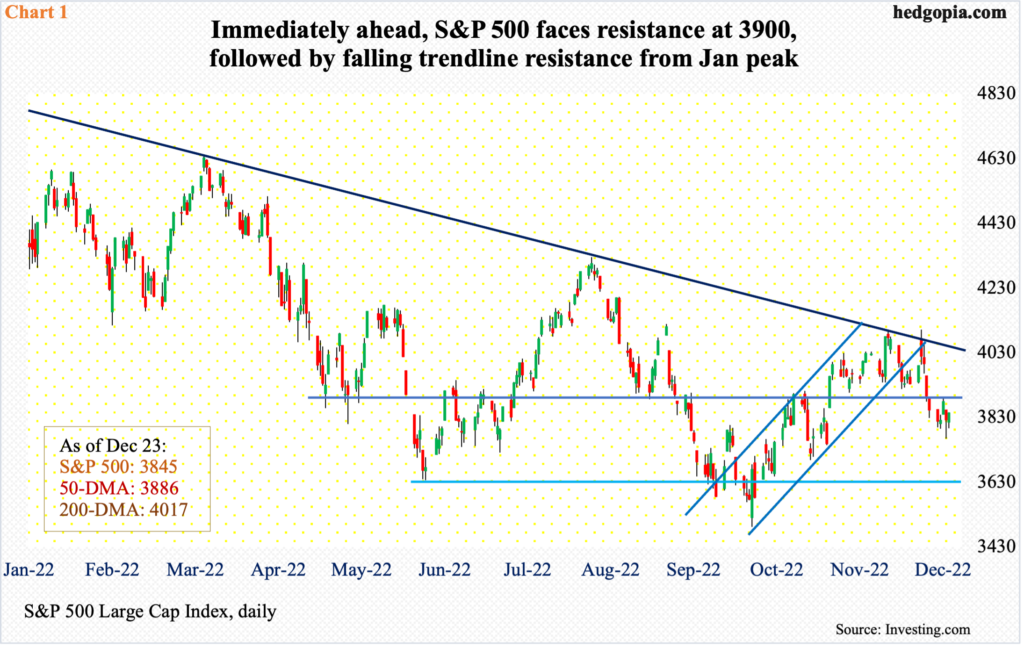
Equity bulls found it very difficult to bust through 4100 on the S&P 500. They tried twice this month – on the 1st and 13th – only to meet with failure. This level approximates trendline resistance from January when it peaked at 4819; on the 13th, failure to reclaim the level also meant the large cap index fell out of a two-and-a-half-month ascending channel (Chart 1); on October 13, the S&P 500 bottomed after dropping 27.5 percent from the January peak.
After the December 13th rejection at 4100, the index dropped all the way to 3764 (not too far away from the November 9th low of 3744) by last Thursday, yet the longs should like how the S&P 500 behaved in that session, which closed at 3822, forming a bullish hammer.
This year, Santa Claus rally failed to materialize, with the S&P 500 down three weeks in a row. How it behaved in the closing sessions last week has raised hopes for a year-end rally. The index inched lower 0.2 percent last week, having reversed higher from down 2.3 percent at Thursday’s low, ending the week at 3845.
There is room for the daily to rally. Immediately ahead, there is horizontal resistance at 3900, which approximates the 50-day moving average at 3886. After that lies the aforementioned trendline resistance.

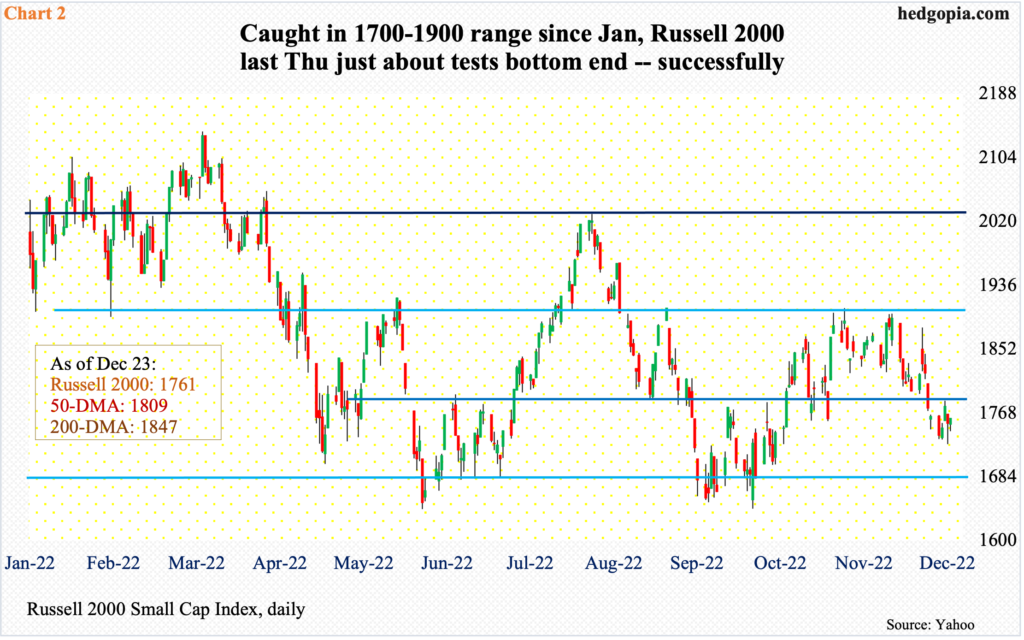
The Russell 2000, too, formed a bullish hammer last Thursday, with the session low 1727 coming pretty close to testing 1700, which represents the bottom end of a 200-point range. Several times in the first half last month and early this month, small-cap bulls tried to unsuccessfully take out 1900, which was lost this August (Chart 2). Subsequently, the small cap index bottomed on October 13 at 1642, down 33.2 percent from the all-time high 2459 reached in November last year.
The 1900-1700 range has been in play since January this year, with 1700 going as far back as June 2018.
After peaking in November last year, the Russell 2000 lost 2080s mid-January; for 10 months leading up to that, the index was rangebound between 2080s and 2350s. It then seesawed between 2080s and 1900, followed by a ping pong match between 1900 and 1700.
As is the case with large-caps, the Russell 2000 can rally here – toward 1800, which coincides with the 50-day (1809).

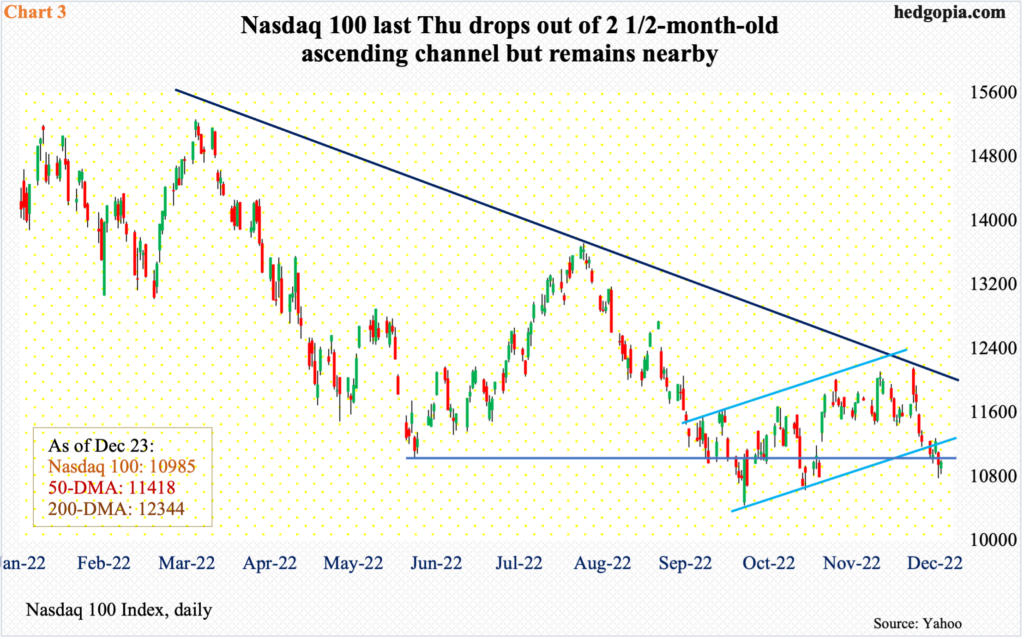
The Nasdaq 100 is not much different. On the 13th (this month), trendline resistance from last December repelled a breakout attempt. The tech-heavy index peaked a month before that at 16765. It then tumbled 37.7 percent through the October 13th bottom at 10441. From that trough, the Nasdaq 100 traded within an ascending channel – until last Thursday when it fell out but remains nearby (Chart 3).
As was the case with the S&P 500 and Russell 2000, tech stocks saw bids show up last Thursday and Friday. The underside of the broken channel gets tested just north of 11000, with the index closing out the week at 10985. After that, there is horizontal resistance at 11400, with the 50-day at 11418.

For these indices to side with the bulls, volatility has to cooperate, and VIX just might.
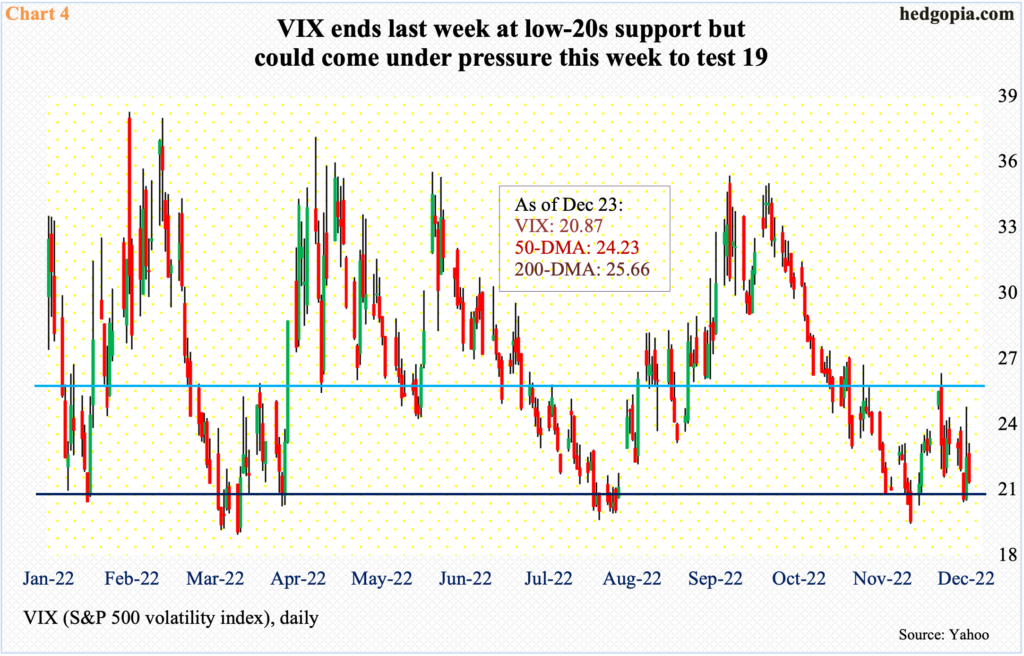
A death cross – the 50-day crossing the 200-day from above – formed on the 9th this month. Since then, rally attempts have been repelled at the 50-day twice – one on the 13th and one last Thursday. Besides the 50-day, Thursday’s session high (24.30) also coincided with the daily upper Bollinger band; the lower band rests at 19.17.
Four weeks ago, volatility bulls defended 19, which has not been sustainably breached since March this year. But unlike the prior two occasions when VIX then went on to rally to 35, this month’s rally was cut short just short of 26 (Chart 4). For now, 19 has the potential to act as a magnet. VIX ended last week at 20.87.
Thanks for reading!

