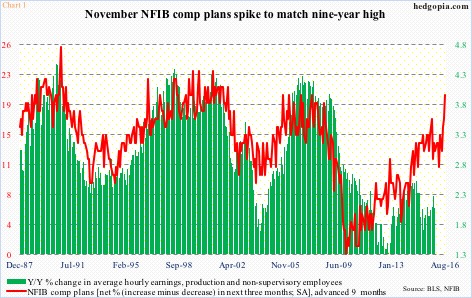
National Federation of Independent Business members’ comp plans jumped three points in November to 20, matching the November 2006 high.
The spike in the red line in Chart 1 is noteworthy. Historically, it has shown a tendency to lead average hourly earnings of production and non-supervisory employees.
The relationship between the green bars and the red line in the chart above have broken down for a while. It is too soon say if the correlation is being reestablished.
That said, the November spike in small businesses’ comp plans has come in the midst of some good news of late in hourly earnings.
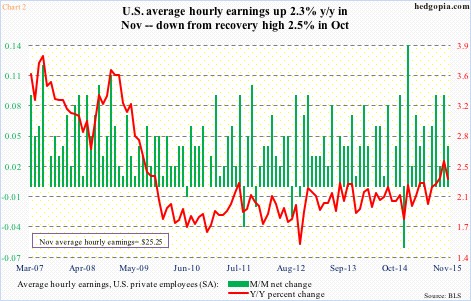
Chart 2 plots earnings of private-sector employees. In October, they grew at 2.5 percent annually – the most since July 2009. In November, the pace softened a bit, but still grew a healthy 2.3 percent to $25.25.
As Chart 2 shows, earnings have been stuck in a rut for a while…. so remains to be seen if the latest trend is a sign of things to come, or just a blip.
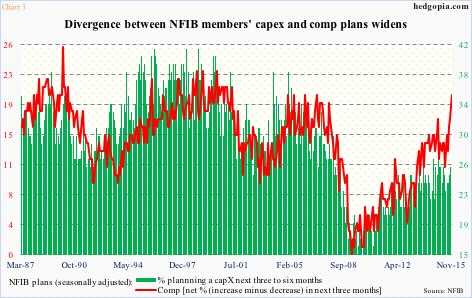
It is worth noting that NFIB members’ comp plans shot up in November, but not capex plans. Historically, they tend to track each other. And businesses are anything but gung-ho about capital expenditures. The divergence between the two has widened (Chart 3).
The November spike in NFIB comp plans is a welcome change, but probably needs reconfirmation in months to come.
Thanks for reading!

