
- Draghi finally delivers, igniting a global rally in stocks
- Here in U.S., sustainability in doubt unless stocks attract some of that money
- U.S. households not likely to be source of funds as money market funds lower than pre-crisis
As expected, the European Central Bank-induced early weakness in U.S. stocks yesterday was scooped up hand over fist. Selling stopped in the very first 15 minutes. While the bias near-term is up, the bigger question is, will some of the €60bn/month Eurozone QE find its way into U.S. stocks?
When it is all said and done, the prevailing strength may well be setting up as another shorting opportunity down the line.
As was discussed yesterday, November did see $5.7bn in foreign purchases of U.S. equities, but the 12-month running total stood at a negative $36bn. There has not been much foreign interest in U.S. equities. It is possible Japan was a factor in November. The Bank of Japan aggressively expanded its QE as soon as the Federal Reserve ended its late October last year.
Now that the ECB is on board the QE bandwagon, unless some of that dough finds its way across the Atlantic and into U.S. stocks, the spontaneous feel-good effect reflected in yesterday’s action runs a risk of wearing out as quickly.
We shall see. This is an intermediate-term risk.
One constant meme we hear on TV and in newspaper is how U.S. households are sitting on boatloads of cash and how it is only a matter of time before it finds its way into stocks. Well, on the cash part, it is not entirely untrue. At 3Q14, household currency and deposits (including money market shares) stood at $10.1tn – the highest ever. Seven years ago, right before the onset of the financial crisis, this was $7.3tn.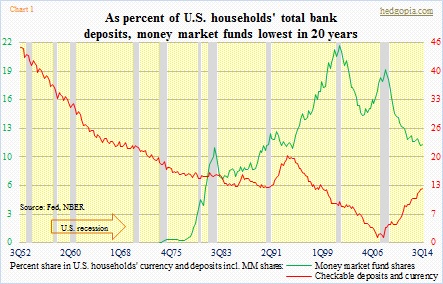
Let us go back to QE discussion for a moment. Here in the U.S., we have had six years of on-and-off money-printing post-crisis. Initially it did a great job of saving the economy from really falling part, but the longer it went on, it increasingly lost its efficacy. This is also true in Japan. Despite all the printing, things are slowing down globally. Just this past week, we had at least five countries making unexpected interest-rate moves – Switzerland, Denmark, Turkey, India, and Peru.
In the midst of all this, who can blame U.S. households for preferring to save a few extra dollars?
As of 3Q14, they had $7.7tn in time and savings deposits, versus $5.9tn pre-crisis. Money-market funds in the meantime dropped from $1.2tn to $1.1tn. From 4Q08, money-market funds are down nearly $500bn. Looking at Chart 1, households have probably taken it as low as they would like. The green line is the lowest in the last 20 years. If there is any consolation, it is that the red line is moving up. There is $1.3tn in checkable deposits and currency, versus less than $100bn pre-crisis.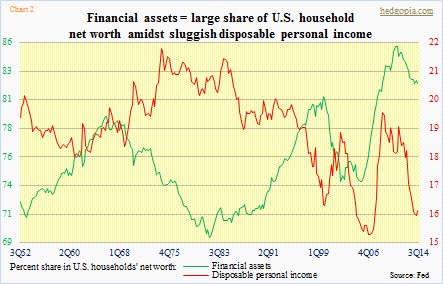
But then again, one look at Chart 2, and one begins to have second thoughts. As a percent of net worth, financial assets already make up 82 percent. This is lower than the all-time high of 85-plus in 1H11, but remains very high. Net worth has risen thanks to the bull market in stocks. But incomes are sluggish. As a percent of financial assets, disposable personal income is only a point higher than the 1Q07 all-time low (red line in Chart 2). One more reason for households to try to hang to what they have.
So let us stop hoping U.S. households would open up their purse and jump on board a six-year-old bull market. Rather let us hope some of that Draghi handout finds its way here.
