
Is the Fed about to make a mistake?
Post-FOMC meeting yesterday, the Fed’s ‘dot plot’ suggested a majority of policymakers were leaving the door open for two rate hikes in 2015. After the release of the statement, TLT, the iShares 20+ Year Treasury Bond Fund, rallied strongly, recovering from early losses. So not sure the bond market is buying the dot plot.
Nonetheless, what if the Fed does indeed move? And would that be a mistake?
There is no way to know until we actually see a rate hike and its impact on the economy. However, the collective wisdom of market participants will not wait that long. Markets will try to divine early – whether or not the economy will slow down, stays pat or accelerates.
The tea leaves can be read many ways. Small-caps, for example, can give off tell-tale signals.
While large-caps have their tentacles spread both in and outside the U.S., small-caps are more domestic-focused. Hence large-caps’ enhanced susceptibility to movement in the dollar versus small-caps.
It has been several months since Fed officials have been giving the markets a wink and a nod about their intention to tighten this year. So far, small-caps have not shown any jitters.
In fact, IWM, the iShares Russell 2000 ETF, broke out of a nearly-one-year resistance in February. This took place even as various macro data points were beginning to shift down.
Fast-forward to the present, and things could not be at a more critical juncture.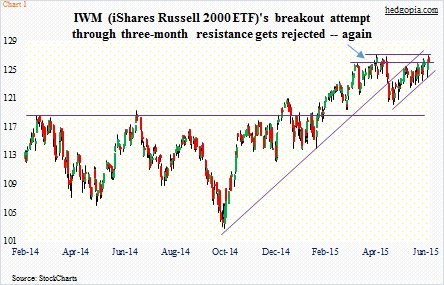
IWM has managed to rally all the way up to the resistance that has repelled all rally attempts the past three months (blue arrow in Chart 1). Yes, the ETF lost its October 2014 trendline late April. Yes, it has only been leading SPY, the SPDR S&P 500 ETF, since May. But a genuine breakout here should speak volumes about what markets think about the risk posed by tighter monetary policy to the economy. Investors/traders buying a breakout have to believe that the risk is minimal.
With that said, the ETF experienced a mini reversal yesterday. Once again, bulls were unable to take out that resistance. Part of the blame goes to how banks fared. KBE, the SPDR KBW Bank ETF, was essentially unchanged until 2PM. Once the FOMC statement came out, it was all downhill, down 1.4 percent for the day (Chart 2).
Financials make up 24 percent of IWM, followed by information technology at 18 percent, and health care at 16 percent. The largest weight – a small 0.65 percent – goes to Qorvo (QRVO), a chip company. Among financials, Investors Bancorp (ISBC) has been given a 0.25 percent weight, and it is in the top 10. The ETF holds 1989 stocks.
The point is, it pays to pay attention to how KBE acts in order to get a read on how IWM may act. KBE is 78 percent regional banks. Reason why it acts similar to KRE, the SPDR KBW Regional Banking ETF. KBE assigns the largest weight – 1.84 percent – to Bank of the Ozarks (OZRK), with a market cap of $4 billion. It has 63 holdings in total.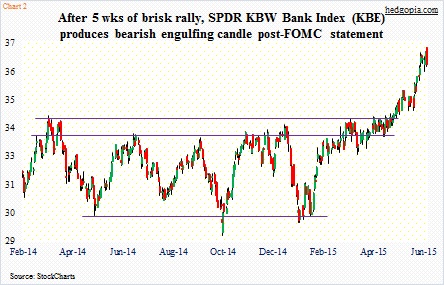
Post-IWM breakout in February, KBE took its time to emulate the feat. But once it broke out, the subsequent rally has been fast and furious, which always raises the risk of a reversal – at times of equal intensity. Yesterday, it produced a bearish engulfing candle – never a good sign when conditions are as overbought as they are on literally every time frame.
So the situation we have is this. Even as small-cap bulls have expended a lot of energy in pushing IWM to three-month resistance, KBE is giving out signs of fatigue.
Can the economy handle higher rates? Time will tell. But investors in at least KBE are probably not waiting around to find that out. Already, the recent spike in the long end of the curve has pushed up mortgage rates, and this does not help these banks.
Thanks for reading!
