
Having stopped responding to improving U.S. fundamentals, the US dollar index currently sits at a confluence of technical support.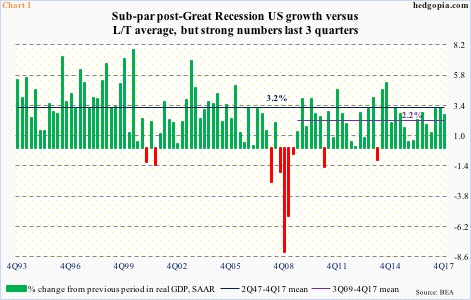
The U.S. economy in recent quarters has put up strong numbers.
Real GDP in 4Q17 grew at a seasonally adjusted annual rate of 2.6 percent. This followed growth of 3.1 percent in 2Q and 3.2 percent in 3Q. This is much better than the post-Great Recession average of 2.2 percent (Chart 1). In fact, the couple of quarters of three-plus-percent growth last year is on par with the long-term average of 3.2 percent.
Similarly, the ISM manufacturing index in January fell two-tenths of a point month-over-month to 59.1, but last September’s 60.2 was the highest since 60.5 in June 2004. January new orders dropped two points from December’s 67.4, which was the highest since 70.4 in January 2004. In other words, manufacturing activity has been strong.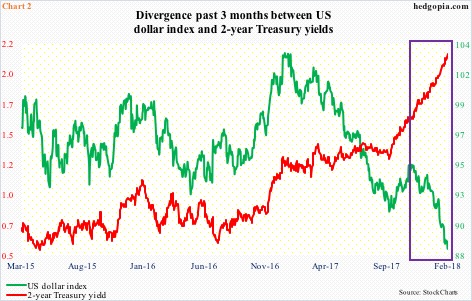
The Fed has been raising rates. After keeping the fed funds rate suppressed near zero for seven long years, it began hiking in December 2015. Rates since have gone up by 125 basis points – to still very accommodative 125-150 basis points.
Two-year Treasury yields that tend to be the most sensitive to Fed monetary policy expectations have followed the fed funds rate higher – from 56 basis points in July 2016 to 2.15 percent last Friday (Chart 2).
During all this, 10-year Treasury yields rallied from the historic low of 1.37 percent in July 2016, but were rejected at 2.62 percent in December 2016 and March 2017. That resistance has now been taken care of. Last Friday, yields closed at 2.84 percent.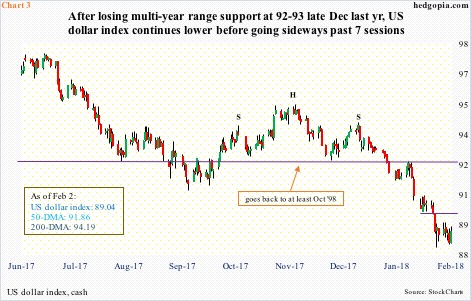
The greenback does not care.
The US dollar index has diverged with two-year T-yields for well over a year now (Chart 2). It peaked early January last year at 103.82, then dropping 15 percent through the intraday low of 88.25 seven sessions ago.
Importantly, after remaining range bound between 100-101 and 92-93 since March 2015, it lost that support late December last year (Chart 3). This support goes back to at least October 1998. There are not too many dollar bulls out there.
Amidst all this gloom and doom, dollar bulls are beginning to see a glimmer of a hope. The dollar index has gone sideways the past seven sessions, and responded positively to last Friday’s jobs report. January created 200,000 non-farm jobs. Plus, average hourly earnings grew 2.9 percent, which was the highest since May 2009.
On the weekly chart, the dollar index formed a spinning top candle last week. 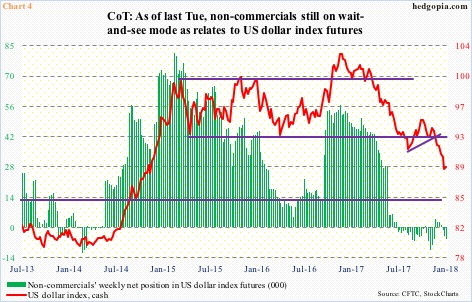
If Friday’s action is not just a fluke, rather has institutional backing, then we should begin to see it in the CoT data.
As of last Tuesday, non-commercials were net short 5,787 contracts in US dollar index futures (Chart 4). Nothing major, but still net short. Since staying net long for three years, these traders went net short last July. Since then, they have gone back and forth, with no major commitment either way.
This is a group worth paying attention to. They are trend riders, and do a good job at it. In the past six months, however, their holdings have pretty much gone sideways, even as the cash has continued lower. It is as if they are waiting for the right time/opportunity to begin to build a long bias.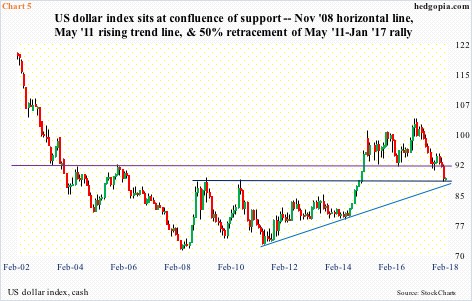
As things stand, the cash sits at a critical juncture. Technically, that is.
Back in May 2011, the US dollar index (89.04) bottomed at 72.70, before rallying all the way to the aforementioned 103.82. A 50-percent retracement of that advance comes to 88.26. Once again, last week’s low was 88.25.
A rising trend line from that May 2011 low also draws to where the dollar index sits right now (Chart 5). Plus, horizontal-line support at 88-89 goes back to November 2008, or even early 2004.
All this at a time when the euro also sits at a potentially crucial juncture.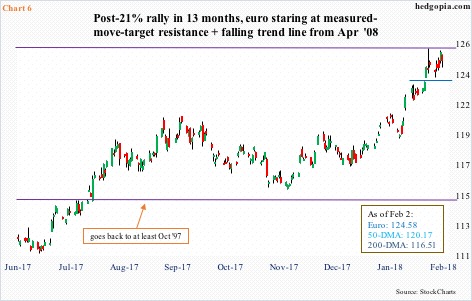
The euro makes up 57.6 percent of the US dollar index. [Other five include Japanese yen (13.6 percent weight), Pound sterling (11.9 percent), Canadian dollar (9.1 percent), Swedish krona (4.2 percent), and Swiss franc (3.6 percent)].
For the second week running, the euro ($124.58) last week hammered on a trend line from the all-time high of $160.20 in April 2008. The week before, it retreated after hitting $125.37. This level also represents measured-move-target resistance of a 10-point range breakout last July (Chart 6).
Non-commercials – trend riders as they are – are the most net long ever. While they have been on the right side of this trade, inflection points are always tricky. It remains to be seen if the euro is at such stage right now, but it is facing technical resistance. Since the lows early last year, it has rallied 21 percent. Should profit-taking begin, the dollar index gets a tailwind.
All this means rising odds that so long as recent lows are not violated, a tradable bottom in the US dollar index is in sight. This week’s CoT data will shed more light on this – to see if hedge funds are beginning to build net longs.
For now, 92 obviously offers stiff resistance. As a matter of fact, even before this, there is short-term resistance at 90 (Chart 3), which is about where the 20-day moving average lies.
Thanks for reading!
