
Following futures positions of non-commercials are as of January 30, 2018.
10-year note: Currently net short 215.6k, up 97.7k.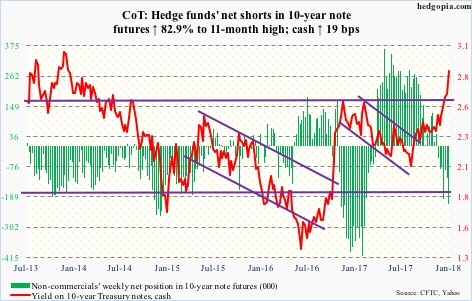
Last week, the futures-market odds of a 25-basis-point hike in the March (20-21) meeting in the fed funds rate stood at 77 percent. This week, post-FOMC meeting, they inched up to 78 percent. After this, at 55 percent, June is the only meeting with more than 50 percent odds of another 25-basis-point raise this year.
The dot plot remains at three hikes this year, and has been there for a while. This was Janet Yellen’s last meeting as chair, so not much change was expected in this forecast anyway. Next week, the torch will be passed to Jerome Powell.
Until now, the Yellen Fed pretty much focused on the lack of inflation as opposed to a healthy job market. Hence the rather slow pace of rate rise. Inflation expectations are on the rise. The five-year, five-year forward inflation expectation rate was 2.29 percent Thursday, up from 1.83 percent last June. Nothing alarming, but a rising trend nevertheless.
As are 10-year Treasury yields, which jumped from 2.03 percent early September last year to 2.85 percent.
The tightening path this year of the Powell Fed likely depends on how much weight is given to these budding inflation fears. The March meeting has a press conference scheduled. Markets are hoping we will hear a thing or two on this subject from Mr. Powell.
30-year bond: Currently net long 53.4k, down 2.3k.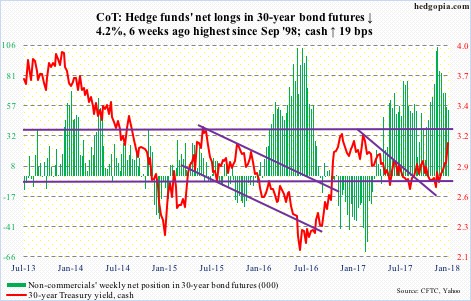
Major economic releases next week are as follows.
The ISM non-manufacturing index for January is due out Monday. Services activity in December fell 1.5 points month-over-month to 55.9. Last October’s 60.1 was the highest ever (data only goes back to January 2008).
Tuesday brings JOLTS for December. Non-farm job openings in November declined 46,000 m/m to 5.88 million. The metric peaked at 6.18 million last September.
Crude oil: Currently net long 788.5k, up 7k.
After dropping 4.5 percent from last week’s high of $66.66/barrel, spot West Texas Intermediate crude ($65.45) Wednesday found support on the 20-day moving average. As a result, this week’s candle has the look of a potentially bearish hanging man.
Prices are stalling amid surging U.S. shale production.
The EIA report for the week of January 26 showed crude production increased 41,000 barrels per day to 9.92 million b/d – the highest since 1970.
Crude imports rose as well – by 389,000 b/d to 8.43 mb/d – a 23-week high.
Ditto with crude stocks, which increased 6.8 million barrels to 418.4 million barrels. This was the first weekly increase in 11 weeks.
Refinery utilization continued to contract, down 2.8 percentage points to 88.1 percent. Utilization peaked at 96.7 percent four weeks ago, which was the highest since August 2005.
Gasoline and distillate stocks, on the other hand, fell – down two million barrels and 1.9 million barrels to 242.1 million barrels and 137.9 million barrels, respectively.
During the mini selloff of early this week, short-term support at $65 was lost, but recaptured quickly. After this, there is support at $62 and $59. The 50-day rests at $60.64.
E-mini S&P 500: Currently net long 172.8k, up 6.4k.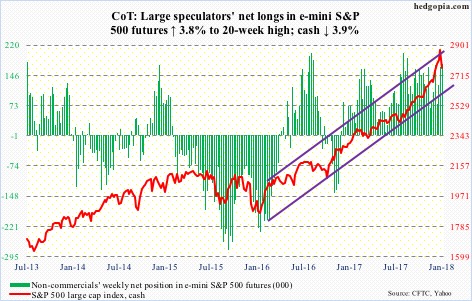
U.S.-listed ETF’s took in a record $68.1 billion in January. Of this, U.S. equity ETF’s attracted $30.8 billion (courtesy of ETF.com).
In the week ended Wednesday – the last day of the month – $5 billion went into SPY (SPDR S&P 500 ETF), $776 million into VOO (Vanguard S&P 500 ETF) and $3 billion into IVV (iShares core S&P 500 ETF).
During the same week, U.S.-based equity funds (including ETFs) took in $16.2 billion. This brings the total in the past four to $60.7 billion (courtesy of Lipper). Unreal!
This obviously helped propel the S&P 500 index (cash) to rally 5.6-percent in January. In fact, at one point it was up as much as 7.5 percent.
With this, the question on the minds of investors is, would the January effect (so goes January so goes the year) come true this year? The market adage does have a good track record.
But then again, it took a lot of buying power for that January return. The S&P 500 lost 3.9 percent this week. Will flows continue to come in to stem more bleeding or longs with paper profit proceed to lock it in? In the latter scenario, the weekly and monthly charts remain grossly overbought.
The cash (2762.13) ended 2017 at 2673.61. The 50-day lies at 2715.15.
Euro: Currently net long 148.7k, up 4k.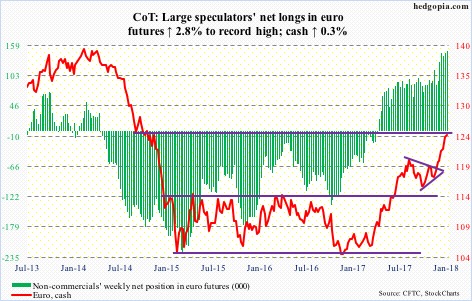
For the second week running, the cash ($124.58) kept hammering on a trend line from the all-time high of $160.20 in April 2008. Last week, it retreated after hitting $125.37. This level also represents measured-move-target resistance of a 10-point range breakout last July.
A convincing breakout here would be massive.
The currency has had improving fundamentals on its back. The Eurozone economy grew 2.5 percent in 2017 – the fastest pace since the three-percent rate seen in 2007.
Plus, non-commercials are net long up to the gills, and have been on the right side of the trade. At the same time, this very factor can pose a risk when these traders decide to lock in profit, particularly considering the aforementioned resistance. Since the lows early last year, the euro has rallied 21 percent.
Gold: Currently net long 207.3k, down 7.4k.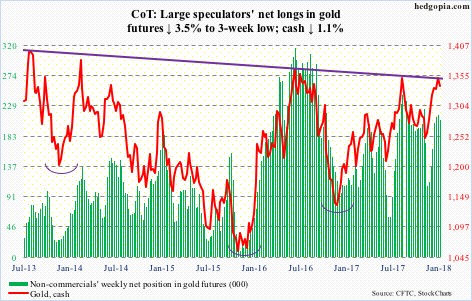
In the past three weeks, the cash ($1,337.30/ounce) saw several long-legged dojis on the daily chart. There is a real tussle going on between the bulls and bears, and this is taking place at an important juncture.
This week’s high of $1,354.30 tested a slightly falling trend line from August 2013, and, as was the case last week, got rejected. This level also approximates the neckline of a reverse-head-and-shoulders formation. Then there is Fibonacci resistance. Gold peaked in September 2011 at $1,923.70, then bottoming at $1,045.40 in December 2015. A 38.2-percent retracement of this decline lies at $1,380.91. Last week, it rallied to $1,365.40.
Thus the significance of where the metal sits currently, and that of flows.
In January, GLD (SPDR gold ETF) and IAU (iShares gold trust) hauled in $180 million and $766 million, in that order. Although in the week through Wednesday, the former lost $345 million, while the latter took in $276 million (courtesy of ETF.com).
Nasdaq 100 index (mini): Currently net long 22.4k, up 7.4k.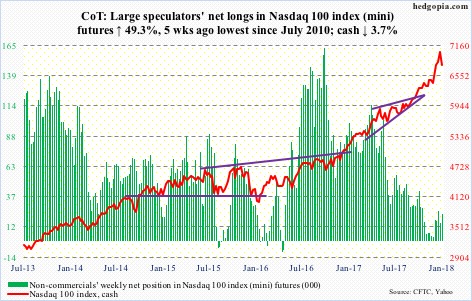
After a rip-roaring January – up 8.7 percent – the cash (6760.29) is beginning to see some selling pressure. Both the 10- and 20-day have been lost – a chink in the hitherto momentum’s armor. The 50-day lies at 6578.01.
The bears have been offered an opening. Let us see how far they can take it.
In the week through Wednesday, QQQ (PowerShares QQQ ETF) gained $646 million, but only $1.1 billion in all of January (courtesy of ETF.com). Non-commercials added to net longs in January, but were never very aggressive. A telltale?
Russell 2000 mini-index: Currently net long 39.2k, up 2.5k.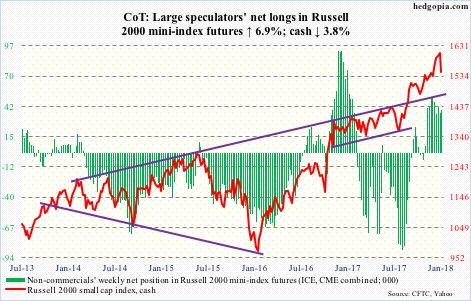
Small-caps continued to lag their large-cap brethren. The cash (1547.27) only rose 2.6 percent in January, with a long wick on the monthly candle. In Friday’s selloff, of the major U.S. indices, the Russell 2000 was the first to lose the 50-day.
Decent support lies at 1515.
IWM (iShares Russell 2000 ETF) lost $1.7 billion in January, while IJR (iShares core S&P small-cap ETF) took in $1 million. In the week ended January 31st, IWM lost $878 million, even as $58 million moved into IJR (courtesy of ETF.com).
US Dollar Index: Currently net short 5.8k, up 1.6k.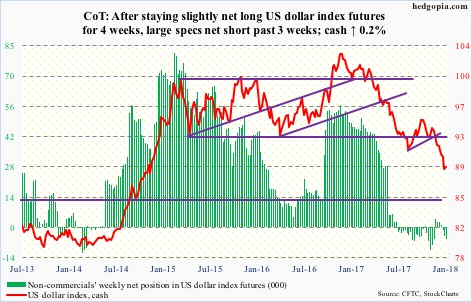
The inability of the cash (89.04) to rally in the face of 10-year Treasury yields that are ripping higher must be unnerving the bulls. Friday, however, was an exception to this, with the dollar index rallying 0.6 percent. During the week, yields rallied another 19 basis points to 2.85 percent, while the dollar index inched up 0.2 percent.
Support at 88-89 goes back to early 2004. The low of 88.25 Thursday last week also tested a rising trend line from May 2011.
As long as recent lows are not violated, a tradable bottom is probably in.
VIX: Currently net short 59.4k, down 30.8k.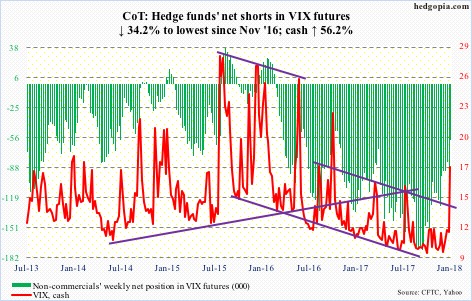
Friday’s intraday high of 17.86 on the cash (17.31) was the highest since November 9, 2016. Back then, VIX had jumped to 23.01 by the 4th, before losing nearly 10 points in the next four sessions.
Unlike several times in the recent past, VIX this time around is holding up – staying above not only the 50- and 200-day but also shorter-term averages. It has not gone sub-10 since January 12th.
It is too soon to say if there has been a change in its character. For that, we will have to wait until volatility begins to subside. How that evolves will be a big tell. In the past, a spike reversal has tended to quickly unwind VIX’s daily overbought condition.
Thanks for reading!
