
Non-commercial futures traders tend to be trend followers, and do a pretty good job of it except at inflection points.
Chart 1 plots these traders’ holdings in Russell 2000 mini-index futures (ICE and CME combined) with the cash. The two pretty much move hand in hand. Although in recent weeks, there has been a slight divergence.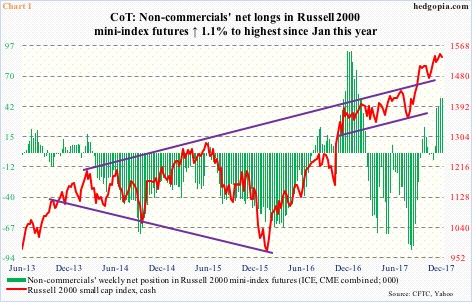
In the week ended November 28, non-commercials switched from net short to net long. Net longs jumped from 6,759 contracts in that week to 50,248 contracts as of last Tuesday. The buildup has been aggressive.
The rub is, the cash has gone sideways the last five weeks.
Concurrently, flows of late into small-cap-focused ETFs have been nothing to brag about.
Since November 28 through last Thursday, $1.3 billion moved out of IWM (iShares Russell 2000 ETF), while IJR (iShares core S&P small-cap ETF) took in $493 million. This compares with 2017 inflows of $1.1 billion into IWM and $6.3 billion into IJR (courtesy of ETF.com).
Put another way, the public is either tapped out and/or is not willing to put more money into the sector.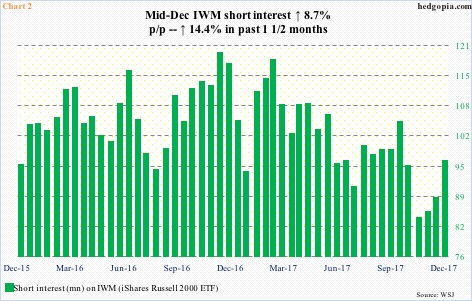
Shorts are smelling an opportunity.
Short interest on IWM has gone up since bottoming at the end of October last year. Nothing big, but it has been trending higher. Mid-December was up 8.7 percent period-over-period to a two-month high (Chart 2).
That said, short interest in all likelihood is not big enough to possibly, and sustainably, provide a fuel for squeeze. Besides, for that to happen, IWM/Russell 2000 first has to break out of the prevailing sideways-to-slightly-down congestion.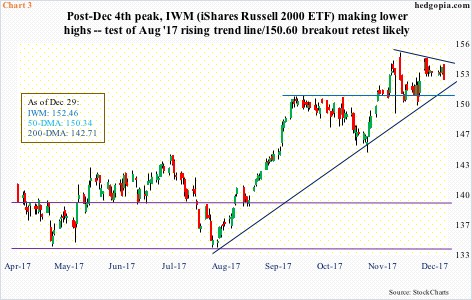
On December 4 last year, IWM peaked at $155.41, and has since made lower highs (Chart 3). Last Friday’s 0.8-percent decline puts the ETF ($152.46) right on the 20-day moving average, but the 10-day has been lost.
The risk facing the bulls is if and when non-commercials lose patience and start cutting back net longs. That in all likelihood does not happen until support at $150.60 gives away. This is where IWM broke out of in the third week of November, followed by several successful retests.
This is raising the odds that the ETF proceeds to at least test the nearest support. A trend line from mid-August last year draws to $152. Then there is that breakout retest of $150.60, followed by the 50-day at $150.34.
In other words, the $150-151 level holds a confluence of support, which, unless 2018 starts out really bad, likely gets defended when tested.
In a week or so, companies will start reporting 4Q earnings. Leading into this, as is typical, estimates have been persistently revised downward. When 4Q began, operating earnings estimates for S&P 600 small cap companies were $10.97; as of December 21, they were $10.16.
In this scenario, a short ratio put spread – a combination of a bear put spread and a naked put write – is hypothetically worth considering.
IWM February 2nd (2018) 1×2 short ratio put spread:
- Long one (1) at-the-money 152.50 put for $2.45
- Short two (2) out-of-the-money 150.50 put for $1.71
The premise behind this trade is this: IWM likely comes under pressure in the next few weeks but not enough to lose the afore-mentioned support. The bias is neutral to slightly down.
The spread earns a credit of $0.97, so there is no upside risk.
If the bulls put their foot down as soon as 2018 is rung in and the underlying rallies, the credit is kept.
A maximum profit of $2.97 is realized if on expiration day the underlying closes at the short strike. Breakeven is at $147.53. After that, it will begin to bite. One of the two short options is naked, hence needs constant monitoring, as the downside risk is large.
Thanks for reading!
