
Spot West Texas Intermediate crude, up 54-plus percent since last June alone, is giving out signs of fatigue.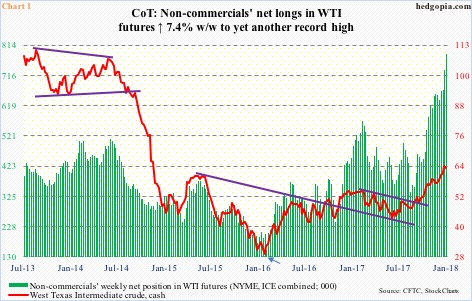
Non-commercials have been on the right side of this trade. As they usually are. These traders follow the trend, and the trend in oil has been up since bottoming in February 2016 at $26.05 (arrow in Chart 1/2). Back then, they were net long 152,814 contracts. Last Tuesday, their holdings had surged to 786,497 contracts – a new record. As recently as last June, they were net long 365,306 contracts.
The point is, they have done well, and could not have ridden the uptrend any better. Except for a decent drop last August, oil has rallied relentlessly since last June. Which also means it has been a while non-commercials’ patience has been tested. One is due.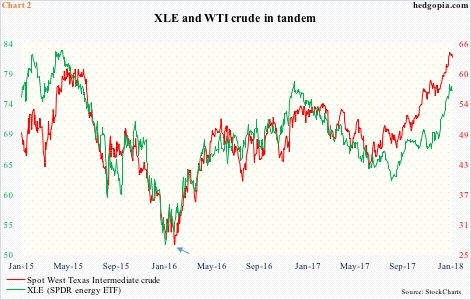
Since that February 2016 trough, oil took care of one after another resistance. Most recently, it broke out of $55/barrel early November last year, followed by a couple of more mini-breakouts – out of $59 late December and $62 early this month. These are levels that the bulls will try to defend for sure when oil comes under pressure.
The intra-day high of $64.89 last Tuesday was the highest since December 2014. The WTI also reversed in that session, followed by back-to-back spinning top candles, before closing the week out right on the 10-day. The daily MACD is on the verge of a potentially bearish cross-under.
Odds favor a retest of the afore-mentioned nearest support.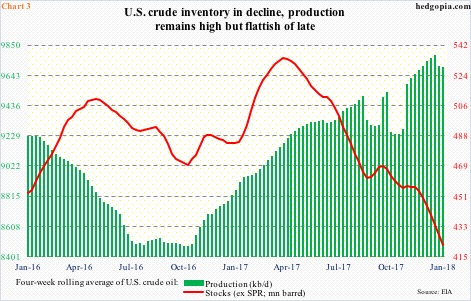
U.S. crude inventory excluding the Strategic Petroleum Reserve peaked in the week ended March 31, 2017 at 535.5 million barrels. By January 12 this year, this had dropped to 412.7 million barrels.
Chart 3 uses a four-week rolling average of both crude inventory and production. The former peaked at 534 million in the week through April 7, 2017, dropping to 422.1 million barrels by January 12 this year. The WTI bottomed on June 21 last year.
This drop in crude stocks gave a nice tailwind to the price. Production has held up, but even here it has been flattish of late, with the latest reading of 9.75 million barrels per day, having peaked at 9.79 mb/d four weeks earlier. The four-week average peaked at 9.78 mb/d two weeks ago, with the latest week at 9.70 mb/d.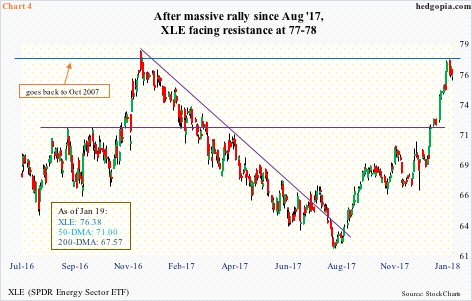
Amidst this improvement in fundamentals we have the WTI acting as if it wants to rest – magnitude notwithstanding – suggesting (1) the good news is priced in, and/or (2) markets expect the improving trend in inventory in particular to end soon.
In the right circumstances, there is a lot of unwinding left in crude. As mentioned above, nearest support lies at $62, then $59. The latter also approximates the 50-day moving average ($58.89). In this scenario, XLE (SPDR energy sector ETF) should follow along. The two in general move hand in hand (Chart 2).
Last Tuesday, XLE rose to a 13-month high of $77.65 intraday, but ended the session with a bearish engulfing candle (Chart 4). Through that high, it rallied north of 25 percent in five months.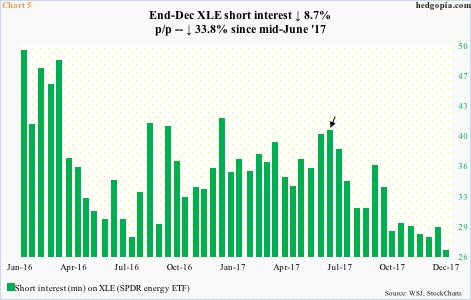
Shorts have paid the price. Short interest on XLE has persistently dropped since mid-January 2016, but the most recent steady drop began mid-June last year (arrow in Chart 5).
In the most recent period (end-December), short interest fell 8.7 percent period-over-period to 26.5 million. This is less than 11 percent of the shares outstanding. Potential fuel for squeeze is running out of oxygen.
In this scenario, a hypothetical trade may be developing here.
XLE’s 50-day lies at $71, and likely does not give way at least in the next several weeks. It thus can be used as a fulcrum to devise a trade – short the underlying in combination with two short March 2nd 71 puts earning $0.25 each. This effectively raises the short price to $76.88, above which the position starts bleeding.
One of the two puts is naked.
If by expiration in the next six weeks, XLE remains above $71, then the puts expire worthless. Between $76.88 and $71, the short position will be in the money. If on the other hand the underlying goes below $71, the short position gets covered; by that time, this would have been $5.88 in the money. This effectively ensures going long the underlying – as the other naked put gets assigned – at $65.12.
Thanks for reading!
