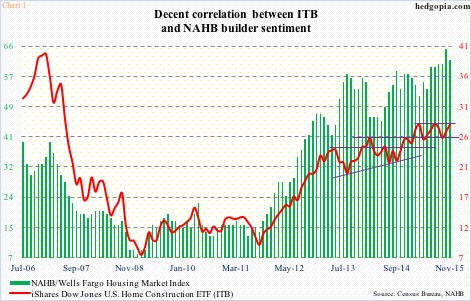
Directionally, ITB, the iShares Dow Jones Home Construction ETF, and U.S. homebuilder sentiment tend to move together. The correlation coefficient is far from perfect, but at 0.68 between May 2006 and November 2015, it is decent (Chart 1).
The National Association of Home Builders/Wells Fargo housing market index bottomed at 13 in June 2011 and was at 14 three months later, before getting on sustained uptrend. ITB, too, bottomed in September that year.
They have both come a long way.
Since March through November this year, builder sentiment has gone up 10 points. In fact, in October, it was at a 10-year high of 65, before dipping to 62 in the preliminary reading for this month. During this, ITB has only gone sideways.
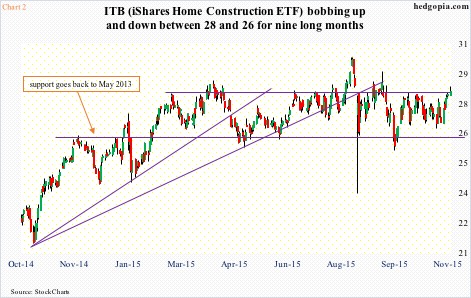
Early February this year, the ETF broke out of $26 – an important price point going back two and a half years. But the post-breakout rally stopped at $28, which since has proven to be an important ceiling (Chart 2). Yesterday, it tried to break out, but was unable to hold early gains.
At least in the near-term, it is hard to see the ETF convincingly jumping over this hurdle.
Is ITB not buying builder enthusiasm then?
First of all, take a look at the gap between builder enthusiasm and U.S. housing starts in Chart 3. To be fair, builders of late have been putting their money where their mouth is. The 1.21-million annualized pace in June this year was the highest since October 2007, but starts have also been declining since. October’s 1.06 million was the lowest in seven months. For the first time in seven months, October saw a month-over-month decrease in the 12-month running average (not shown here).
Starts are losing momentum, with builder sentiment at a lofty level. In the past, the wider the gap between the green and red lines in Chart 3, the former eventually heads lower, dragging the latter along with it (arrows in the chart).
The gap between builder sentiment and new home sales is even starker (not shown here). The latter was a disappointment in September, down 11.5 percent month-over-month, to a seasonally adjusted annual rate of 468,000 units – the lowest since November last year (Chart 4). This tends to be a volatile series month to month.
That said, momentum in new home sales at least flat-lined in September. At 496,000 annualized units, the 12-month rolling average was unchanged sequentially, and was the first time since July last year that it did not grow month-over-month (Chart 5). The median price – $296,900 – in September was a mere 1.9 percent from the all-time high last November. This has to impact sales – negatively, of course.
October’s new home sales are due out tomorrow. Existing home sales for the same month were released yesterday. The latter fell 3.4 percent in October, to 5.36 million annualized units. July’s 5.58 million units were the highest since 5.79 million in February 2007. And sales are down 3.9 percent from the July high. Nothing big. Besides, the 12-month rolling average in October was 5.22 million – the highest since October 2007 (not shown here). So the momentum is not completely gone.
The pending home sales index peaked at 112.3 this past May – the highest since May 2006 – and has since dropped five and a half points. As is seen in Chart 5, the two tend to closely track each other, with the red line leading.
This, and other issues, is what ITB is probably focused on at the moment, not just builder sentiment.
The question is, if sentiment comes under pressure, will ITB ($28.25) follow it lower?
Some loss of momentum has been seen of late in sales of homes. Builder sentiment remains lofty. In a scenario in which sentiment goes sour and ITB follows suit, $26 is a must-hold. As important as this support is, a breakdown will be potentially tradable. Fingers crossed.
Thanks for reading!


