
Recent inflation readings have firmed up, although remain subdued historically. As have inflation expectations. What happens with crude oil, which rallied big the past couple of years, is worth watching.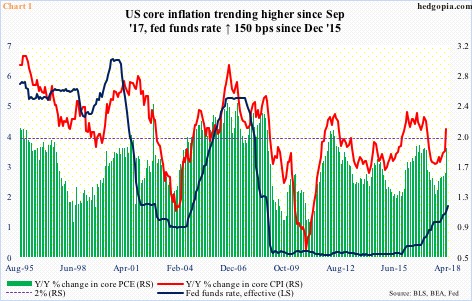
Later today, the FOMC concludes its two-day meeting – the year’s third. Five more scheduled meetings remain this year. From the interest rate perspective, this one is a non-event. The fed funds rate is expected to remain unchanged at 150-175 basis points.
The critical thing is what they signal – or not – about the future. Currently, the futures market is pricing in two more 25-basis-point hikes in the remainder of this year, with the odds in June (12-13) of 89.6 percent and in September (25-26) of 66.5 percent.
In March, the FOMC’s dot plot expected three hikes this year. In that meeting (20-21), the fed funds rate was raised by 25 basis points. Some market participants – although a minority – still fear the Fed might go for four.
Inflation is front and center in this regard.
On Monday, March’s core PCE (personal consumption expenditures) – the Fed’s favorite measure of consumer inflation – was released. It jumped 1.88 percent year-over-year, up from 1.57 percent in February. It is still below the Fed’s goal of two percent, but has trended higher since last September (last time it was above that threshold was April 2012). Ditto with core CPI, which rose 2.12 percent y/y in March – the first two-plus reading in a year (Chart 1).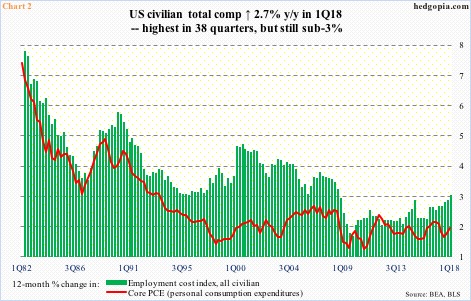
But how sustainable is this trend?
Using core PCE on a quarterly basis, it looks less alarming than if we were to only focus on monthly numbers. In 1Q18, this metric rose 1.66 percent in the 12 months to March. Even here, the short-term trend is up, but not medium- to long-term. This is also true with compensation.
In 1Q18, the employment cost index for all civilian workers increased 2.71 percent y/y. It has trended higher since growing at 1.94 percent two years ago. In fact, the 1Q18 reading was the highest since 3Q08, although we are still talking a two handle. That is how suppressed comp growth has been (Chart 2). No wage-push inflation out there. And signs are not pointing that way either. At least not yet.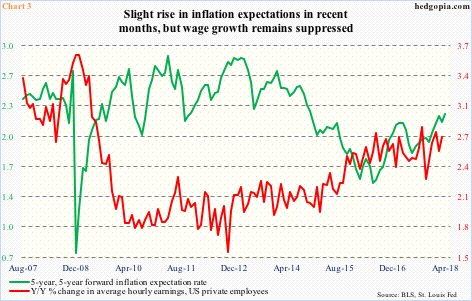
One month short of completing nine years of recovery, the economy is yet to see sustained upward pressure on wages.
Besides the employment cost index, another metric – the average hourly earnings of private-sector employees – shows the same trend. In March, this metric increased 2.72 percent y/y, and has not broken through three percent since May 2009. Growth has more or less gone sideways since July 2016.
Interestingly, inflation expectations – measured by the five-year, five-year forward inflation expectation rate – bottomed in June 2016, before trending higher. It has trended higher along with core PCE/CPI. Once again, the uptrend is a short-term phenomenon, not medium- to long-term. The risk is if ‘short’ continues to shift toward ‘medium’/’long’.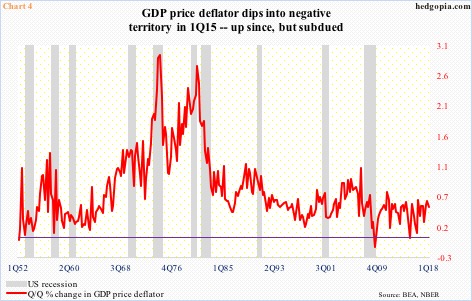
Speaking of the possibility of a trend shift – or a lack thereof – take a look at Chart 4. The GDP price deflator measures prices of all new, domestically produced, final goods and services in the economy. Unlike, let us say, the CPI, which is based on a fixed basket of goods and services, the deflator’s basket is allowed to change with consumption and investment patterns. At least in theory, it is more up-to-date.
In 1Q18, the deflator rose 0.49 percent quarter-over-quarter, having essentially gone sideways for 10 years. In fact, in the second and third quarters of 2009, it dipped into negative territory, and then again in 1Q15. A negative reading is rare, as the chart shows.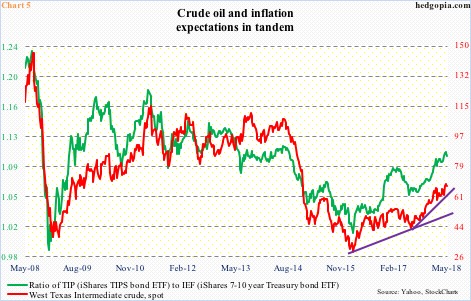
Until not too long ago, the US economy was gripped by fears of deflation.
Spot West Texas Intermediate crude ($67.25/barrel) began a waterfall dive from north of $100 in June 2014 (intraday high of $107.68), before bottoming at $26.05 in February 2016. It then rallied to a high of $69.55 on April 19. All along, inflation expectations – measured by a ratio of TIP (iShares TIPS bond ETF) to IEF (iShares 7-10 year Treasury bond ETF) – moved hand in hand. The two tend to move in tandem (Chart 5).
Hence the importance of where crude oil might be headed. It has had a monster of a rally the past couple of years. Resistance at $69-70 goes back to August 2005. Last week produced a long-legged doji, with signs of fatigue. Immediately ahead, support lies at $66.50-ish. After that, trend-line support from June last year rests around $63, followed, in a worse-case scenario, by trend-line support from February 2016 around $53.
Near- to medium-term, oil’s path of least resistance is likely down. Inflation expectations should follow.
Thanks for reading!
