
Nasdaq shorts, with record short interest, are positioning themselves for a breakdown in the index, or the highly concentrated Nasdaq 100. Breakdown in tech is sure to adversely impact the S&P 500, the other large cap index.
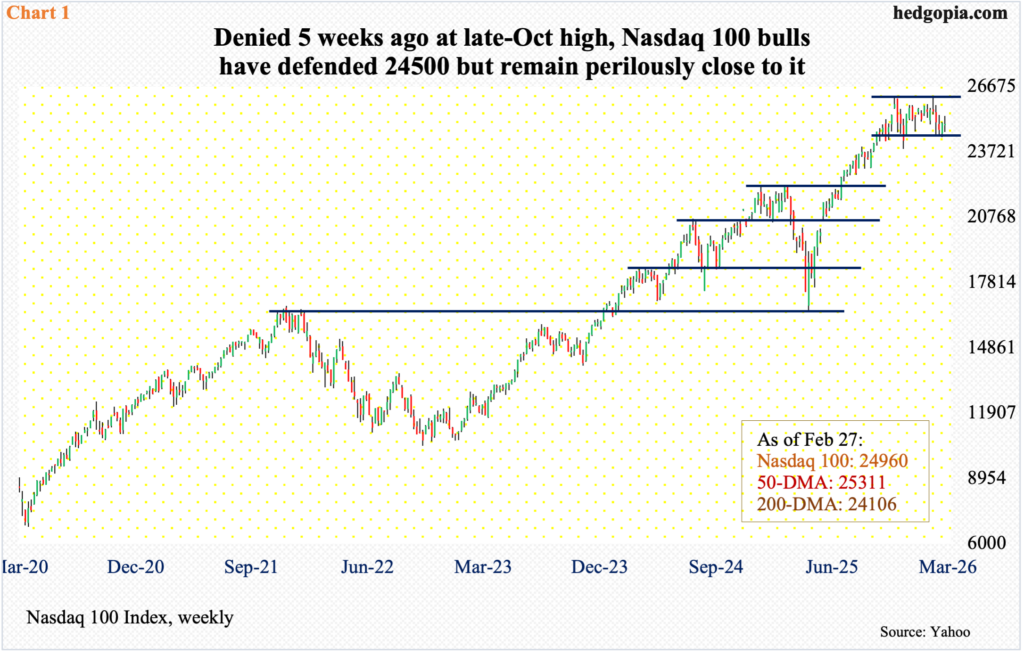
Last week, the Nasdaq 100 dropped 0.2 percent to 24960. Monday’s session low 24618 attracted bids just above straight-line support at 24500, while Wednesday’s high 25344 drew sellers at the 50-day moving average (25311); as a result, a spinning top formed on the weekly.
The tech-heavy index has been under the 50-day since 3 February.
Tech bulls were also denied on 28 January when the Nasdaq 100 came within 17 points of the all-time high 26182 recorded on 29 October (Chart 1). Earlier, it shot up 58 percent between the intraday low of 16542 on 9 April and the October high. A symmetrical triangle from that high broke to the downside four weeks ago.
Concurrently, the index gave back 2.3 percent last month. This follows back-to-back monthly dojis in January and December, preceded by November’s hanging man.
At some point, the Nasdaq 100 looks headed for the 200-day, which is not that far away at 24106. Should this come to pass, bulls would have lost 24500.
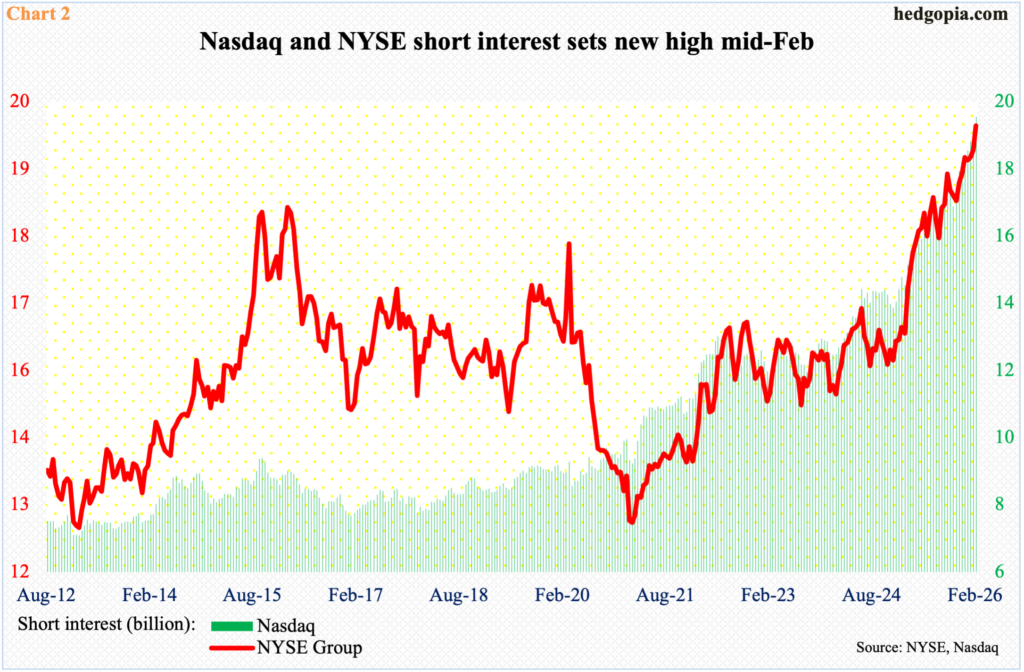
This is an ideal scenario for shorts who have accumulated record short interest on the Nasdaq Composite. Mid-February, short interest on the index rose 1.9 percent from the previous period to 19.6 billion. The data comes out twice a month. The latest count represents the eighth consecutive rise period-over-period. Mid-October last year, short interest was 16.9 billion (Chart 2).
On 29 October last year, the Nasdaq Composite tagged 24020 and headed lower. After a lot of back-and-forth action for weeks, the index on 28 January sought to take out that high but came up short with a high of 23988. All along, shorts have been adding to positions.
This also holds true for the NYSE Composite, where short interest hit a fresh high mid-February, reaching 20 billion. At the end of October, the count was 18.6 billion.
Looking at the way Nasdaq shorts have been adding to their bearish bias, they seem convinced that the Nasdaq, and the Nasdaq 100, are destined to break down on the downside.
Should this come to pass, this will have also impacted the S&P 500, adversely of course. The Nasdaq 100 consists of 100 of the largest non-financial companies. The S&P 500 is a larger large cap index, with heavy tech weighting. The Magnificent 7 wields an inordinate influence of nearly 31 percent on SPY (SPDR S&P 500 ETF Trust).
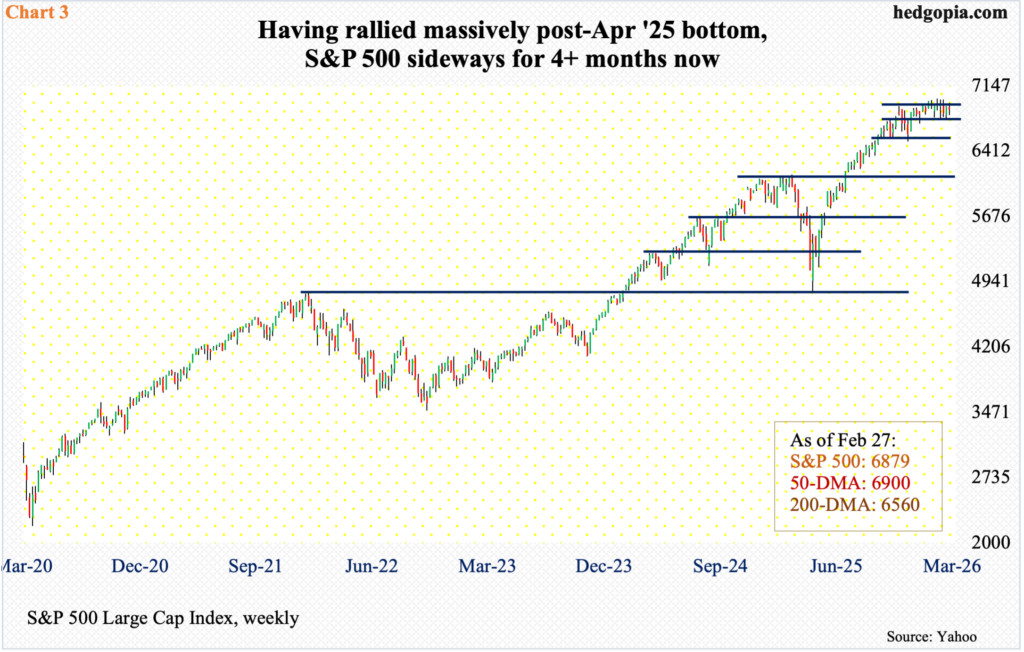
In this regard, the S&P 500, too, is showing signs of fatigue. It has been sideways since late October last year when it tagged 6920s. The consolidation follows a massive rally from last April when the index bottomed at 4835.
Last week, the S&P 500 shed 0.4 percent to 6879, with 6800 drawing bids on Monday and Tuesday, with a low of 6815, and Wednesday’s high 6953 denied at the falling trendline from 28 January when the index posted a new all-time high 7002. When it was all said and done, the 50-day at 6900 was breached by Friday. For the week, a spinning top was formed. This was the fourth time this candle showed up in the last seven weeks (Chart 3).
Importantly, on the monthly, February finished with a spinning top, which also showed up in December and January. This was preceded by November’s hanging man.
For bulls’ consolation, 6770s, which goes back nearly five months, remains intact. An imminent breach will open the door to an eventual test of lateral support at 6500s, which lines up with the 200-day at 6560.
Sentiment remains bullish and has been that way for a while now.
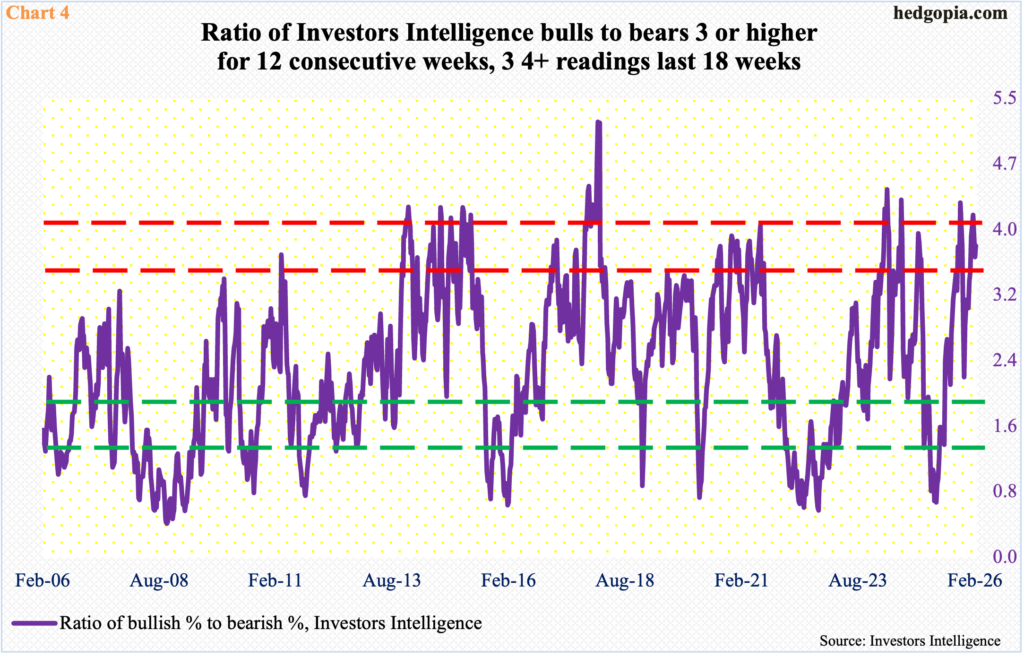
In the week to last Tuesday, Investors Intelligence bullish percent expanded nine-tenths of a percentage point week-over-week to 55.6 percent – one of the 13 consecutive weeks in which the reading was north of 50 percent, with two readings of 60-plus percent in late January-early February.
Bears were 14.8 percent in the latest week, matching the reading of early November last year. This equates to a bull-bear ratio of 3.76, representing a 12th consecutive week of three or higher, including one four-plus count. Going back to the last 18 weeks, there have been three four-plus readings.
The point is, bullish sentiment is stretched, although it is not out-and-out frothy (Chart 4). The major equity indices are consolidating their massive gains from last April. Profit-taking might begin once major support levels are breached.
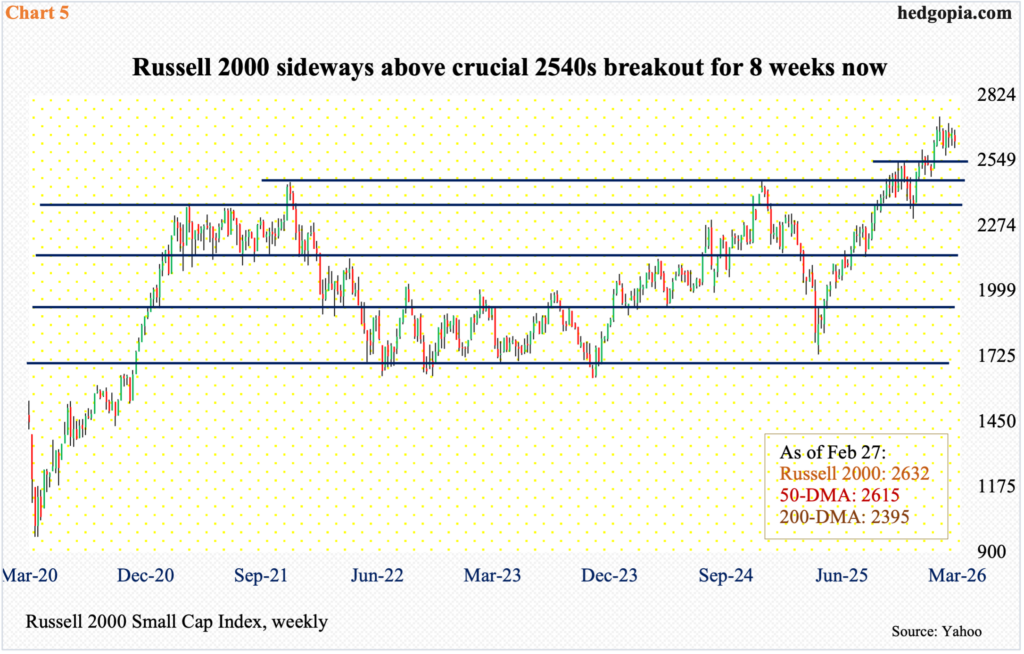
From the risk-on perspective, how things transpire in the small-cap arena will therefore be important. The Russell 2000, in this regard, experienced an important breakout at 2540s eight weeks ago. Shortly thereafter, on 19 January, it peaked at 2735, before proceeding to make several lower highs – all this above the crucial 2540s breakout (Chart 5). Concurrently, the rising 50-day (2615) has provided support. Once the average is lost, 2540s may just act like a magnet. After this, the next crucial retest lies at 2460s.
Last week, the index gave back 1.2 percent to 2632, with a high of 2680 and a low of 2601, helping form a weekly spinning top – one of the three in a row. Looking at the way the index is trading, 2540s is likely to be retested sooner than later. It is a must-save for the bulls, and for risk-on sentiment. A hit to risk-on sentiment will be welcomed by Nasdaq shorts.
Thanks for reading!
