
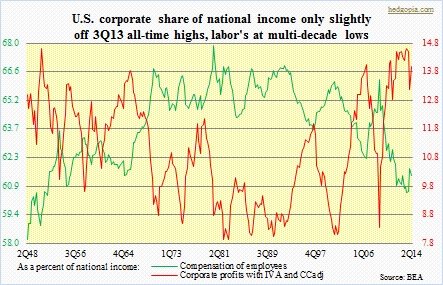
 The importance of margin debt in U.S. equities’ persistent grind higher cannot be stressed enough. Other sources of funds are simply no match – at least have been that way a while. Despite persistent, year-in-year-out talk of an impending selloff, bonds continue to get bid up. Year-to-date, the iShares Barclays 20+year Treasury Bond Fund is up 16 percent (was up 19 percent as of August 29th intra-day high). Workers’ wages have been ticking up lately, but nothing to write home about. In August, average hourly earnings of total private employees rose 2.1 percent year-over-year – barely keeping up with inflation. Labor’s share in national income is at multi-decade lows versus corporations’ which are near all-time highs. Last but not the least, net new cash flow of mutual funds into stocks turned negative in July (the latest month the ICI has made the data available). This was the second consecutive month of negative flows into stocks. Monthly flows peaked in January at around $24bn and had been decelerating since, and are now in negative territory.
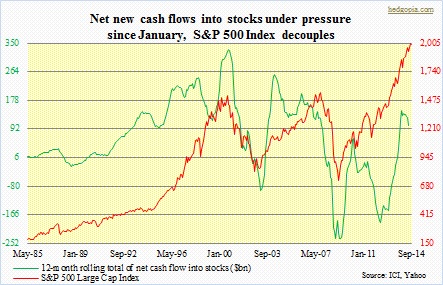 To be clear, between the S&P 500 Index and net new flows into stocks it is hard to say who leads or lags. But going back at least three decades, directionally they do follow each other. Until now, that is. As the adjacent chart shows, the index has decoupled. The 12-month rolling total of flows peaked in February. The index did drop six percent beginning mid-January but as it turns out that was just a blip. Stocks continued higher. Flows however failed to improve along with the early-February bottom in stocks. Worse, there is a double-whammy effect. Not only have flows gone negative but ‘cash as a percent of mutual fund assets’ stands at a mere 3.5 percent, near historical lows. No dry powder. These funds are not in a position to dip into their cash horde. Already, money-market funds have probably done what they could. Year-to-date, $133bn has come out of these funds. June, July saw outflows, but weekly data show August has seen inflows into money-market funds – not something mutual funds would want to see. Amidst all this, who is holding down the source-of-fund fort? Margin debt. Scary but true.
