
The S&P 500 sits at/near October lows. How the bull-bear duel resolves in the next few sessions will decide the path of least resistance in this seasonally favorable period. Options and investor sentiment do not reflect panic. If stocks rally here, this will not mark a major bottom.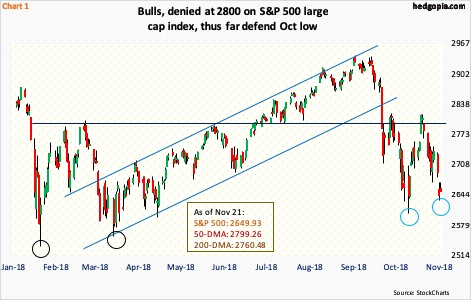
The S&P 500 large cap index (2649.93) is teetering on a breakdown. This week, with one session to go, the index is down another 3.2 percent. On a weekly closing basis, the lows of October have been breached, but not on an intraday basis (Chart 1). Bulls hope to keep it that way.
After the low of October 11th, the S&P 500 rallied, but only to get rejected at 2800. Then post-October 29th low, it rallied again – once again to get rejected at that resistance. The good thing – from bulls’ perspective – the intraday low of late October is intact. Will it hold? Action today and early next week should provide more clues.
Things can unfold two ways – a bullish case near term where bulls begin to get more assertive ahead of a seasonally favorable period, and the other where bears, who have smelled blood, keep pushing. In the latter, it is only a matter of time before October lows get broken.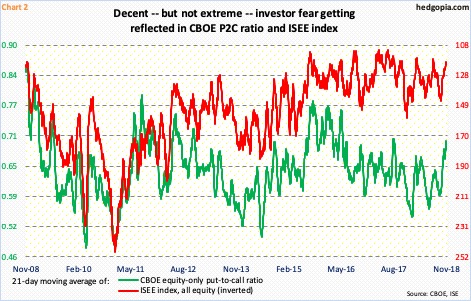
A look at the options market shows both scenarios are possible, with different ramifications.
Chart 2 plots the 21-day moving average of the CBOE equity-only put-to-call ratio and the ISEE index, all equity. The latter is a call-to-put ratio, hence inverted. Since late September/early October, both have unwound quite a bit of investor optimism that was getting built in. That said, bearish sentiment has not pushed extreme territory, particularly on CBOE.
Since the S&P 500 began a waterfall dive on October 3rd through the low of October 29th, it dropped 11.4 percent. In the 35 sessions since that high, there has not been a single session with a 0.9 print on CBOE, let alone one. There have been six sessions in the 0.80s.
Readings of one or above are rare. The last time the CBOE put-to-call ratio printed one was June 2016 – 1.01 to be exact on the 24th that month), and before that January 2016 (1.14 on the 15th), just before a major low in US stocks was reached in February 20116. From that low through the all-time high of September 21st this year, the S&P 500 jumped 62.5 percent!
What this probably tells us is that if the S&P 500 bottoms here, (1) this will be nowhere near the lows of February 2016, and (2) shorts likely try to get active around 2800 again.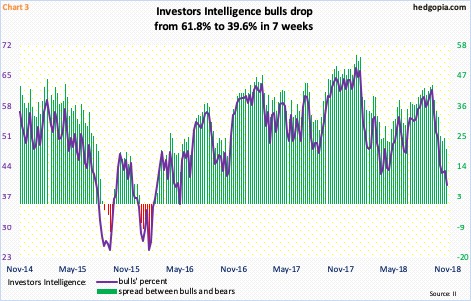
This is also evident in Investors Intelligence data.
In the week in which the S&P 500 peaked early October, bulls registered 61.8 percent, which was the highest since 66 in late January this year. This week, bulls dropped to 39.6 percent, even as bears rose to 19.8 percent.
For reference, in February 2016, bulls’ count shrunk to 24.7 percent, and bears reached 39.8 percent. The spread between the two went negative (Chart 3). Currently, it is 19.8 percentage points. This does not reflect panic, but is low enough it can begin to widen; in this scenario, stocks will rally, but with both duration and magnitude likely hemmed in. Action in the next few sessions should tell us more.
Thanks for reading!
