
- Options market at levels consistent with bottom in stocks, at least near-term
- Signal in midst of several other grossly oversold technical indicators
- Tone of rally to decide if it is investable or tradable bottom
Extreme readings in the options market can serve as useful contrarian indicators. The CBOE provides its put-to-call ratios along three categories – total, index, and equity only. Index volume includes institutional hedging so from a contrarian perspective its signal runs a risk of bias. The equity-only ratio is relatively better. It is calculated by dividing the number of puts by the number of calls. From the contrarian sentiment perspective, the higher the better. The ISE sentiment index is the opposite. It divides puts into calls. That is why in the chart it is inverted. The ISEE index differs from the CBOE put-to-call ratio one other way. It only uses opening long customer transactions. Market maker and firm trades are excluded. So this can be a better reflection of investor sentiment. At least that is how the ISE bills its product. And makes sense, come to think about it.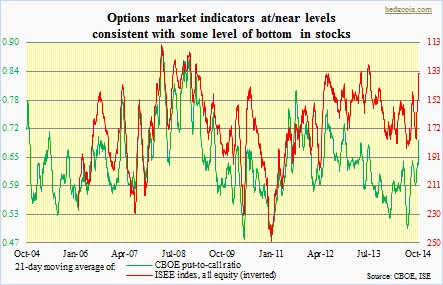
As things stand now, the CBOE put-to-call ratio is yet to flash absolute panic. For the last several sessions, the share of puts traded versus calls has risen, but the ratio only managed to rise to 0.91 (October 13th). The last time we had a one-plus reading was on August 1st (1.04). The difference this time around is that there have been several readings in the 70s and 80s. As a result, the 21-day moving average of the ratio is inching higher – currently just short of .7. In the past, stocks have shown a tendency to bottom out when the 21-dma moved into the low- to mid-70s. The ISEE index is different. It is fast approaching levels that in the past have flagged maximum caution on the part of equity investors. And that have been a place to dip one’s toes into stocks.
This is coming in the midst of several other technical indicators flashing ‘things are overdone near-term’. (These indicators are even more oversold now.) Of course, markets can stay oversold longer than one might think, the same way overbought markets can stay that way for prolonged periods. One thing is certain. In just a matter of few weeks, the tenor of the market has changed. Indices have suffered technical damage, and there were signs of forced selling on Wednesday (hello, elevated margin debt!). Are we still in a bull market or sentiment has shifted into a bear? It may be a little too early to be asking but it is no longer a wrong question. We will get indications to that effect depending on what kind of rally we get in the next few days/weeks. There are several levels where bears can come back growling. And they will. For now on the S&P 500 index (1863), 1905 is an important level to watch.
