
XLP, the SPDR consumer staples ETF, just made a new all-time high on May 10th before backing off, and coming down hard.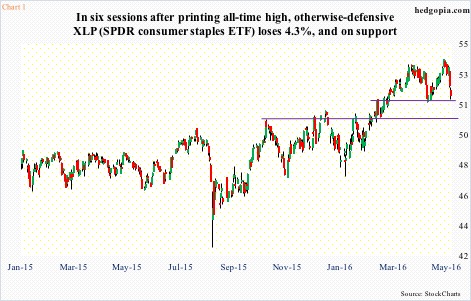
In contrast, most major U.S. indices peaked last year, and some even earlier, like the Dow Transports, which peaked in 2014. These indices’ recent highs came much earlier than consumer staples did, with the S&P 500 large cap index, the Dow Industrials and the Dow Transports peaking on April 20th, the Nasdaq 100 a day earlier, and the Russell 2000 small cap index on April 27th, among others.
In normal circumstances, consumer staples leading, along with utilities and healthcare, for instance, would suggest a risk-off environment, and vice versa. But consumer staples have led for a while, with healthy flows.
Since the low on January 20th through this Tuesday, XLP has attracted $1.5 billion (courtesy of ETF.com).
By nature, XLP constituents are defensive in nature, pay out well in dividends, and tend to outperform most other sectors – relatively – during downturns.
XLP’s top five holdings are: Procter & Gamble (PG), 11.6 percent; Coke (KO), 9.6 percent; Phillip Morris (PM), 8.1 percent; CVS Health (CVS), 6.2 percent; and Altria Group (MO), 5.9 percent. They respectively yield 3.3 percent, 3.1 percent, 4.1 percent, 1.6 percent, and 3.5 percent.
The S&P 500 index yields 2.1 percent.
Also, food & tobacco makes up 34.3 percent of XLP, beverages 21 percent, personal & household products 20.7 percent, food & drug retailing 14.6 percent, among others – once again, all defensive in nature.
Here is the thing.
If defensives are already leading, and stocks in general begin to come under pressure, would consumer staples or not fulfill the traditional role of a port in the storm?
Since XLP peaked six sessions ago through Wednesday’s intra-day low, it quickly lost 4.3 percent. The S&P 500, since the April 20th high through yesterday’s low, shed 3.6 percent. In other words, XLP has acted like anything but a sanctuary. And it has room to continue to come under pressure.
The May 10th peak took place just outside the upper Bollinger Band. The low yesterday nearly approached the lower band, in the process losing shorter-term moving averages as well as the 50-day moving average ($52.83).
There is also a bearish daily MACD crossover, as well as weekly. The latter could be important as other weekly momentum indicators seem to be rolling over as well. Month-to-date, the monthly chart has produced a shooting star – potentially a bearish development medium-term.
Near-term, with the drop yesterday, XLP ($51.92) bounced off the first line of support, at $51.50-ish (Chart 1). The next one lies at $50.50.
What happens next may have a lot to do with how shorts react to the rather quick drop.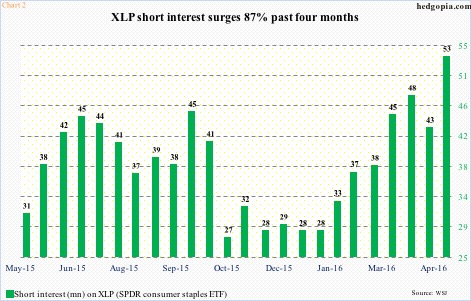
Short interest on XLP has surged 87 percent in the past four months. The latest data is as of April 29th, and short interest stood at 53.1 million shares at the time.
Interestingly, XLP bottomed on January 20th, ahead of most U.S. indices, which bottomed on February 11th, and rallied hard. Since the end-December 2015 low, short interest gradually rose even as the ETF was rallying.
If shorts decide to lock in profit – either right here or from near $50.50 support – and XLP stabilizes, that likely creates an opportunity to go short again near 50-DMA, which is beginning to go flat to slightly down.
Wait and watch for now.
Thanks for reading!
