- U.S. rig counts have continued to drop since September
- This is yet to negatively impact well-paying oil and gas jobs
- Although weekly hours of support activities peaked in Mar last year
U.S. rig counts are on the decline. As of yesterday, they stood at 1,750, down 181 from 1,931 in September last year. The September high was below the highs reached in 2008 and 2011, but rig counts have come a long way from just under 900 in mid-2009 (Chart 1).
Not surprisingly rigs track price of oil, which has been more than cut in half since June last year. A logical conclusion is that rig counts are not done going down. It is just a matter of by how much, which obviously will depend on when oil price reaches stability and the new range it will trade in.
The sell-side has begun to cut earnings expectations for the energy sector. As per FactSet, the estimated 4Q14 earnings growth rate for S&P 500 companies is 1.1 percent (no, not a typo), down from an estimated 8.4 percent at the start of 4Q. Growth estimates for all 10 sectors have been revised lower, led by energy. The sector is now expected to report a 19.1 percent decline in earnings, versus growth of 8.1 percent expected at the start of 4Q. That is a 27-point swing!
This will have repercussions for capital expenditures, and of course, employment. We are beginning to hear companies lower capex plans for this year, and will probably hear more as they start reporting earnings.
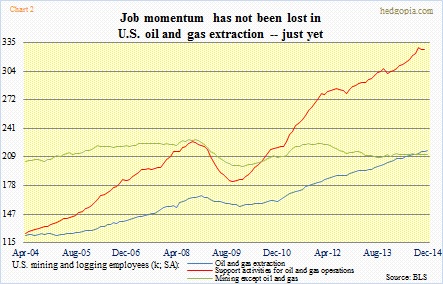
Interestingly, although rig counts have been going down the past three months, it has not yet had negative impact on employment. Employment in ‘oil and gas extraction’ in December was at a new high (Chart 2). “Support activities for oil and gas operations’ has been going sideways since September highs. Look at those steep slopes. Since the 2009 lows, both these categories have created tons of jobs. That is when rig counts started to go vertical. To get an idea about the extent of contribution from oil and gas, the green line is ‘mining except oil and gas’, and it is flat as a pancake for over a decade now.
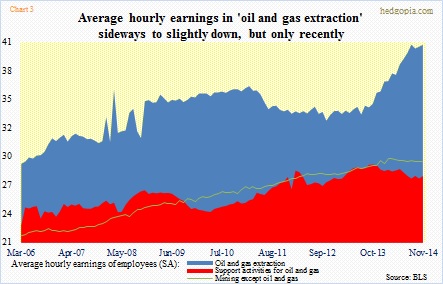
These are well-paying jobs. ‘Oil and gas extraction’ pays nearly $41 an hour (Chart 3). After a sharp spike since the middle of 2013, they have gone sideways since August—$40.89 versus $40.87 in November. Similarly, “support activities for oil and gas operations’ peaked in October last year. Not sure if there is a message here.
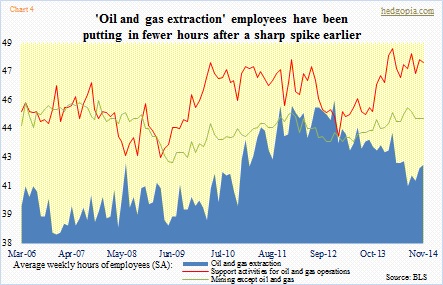
But this much is clear. Although while oil and gas employment looks stable, some subtle changes could be noticed elsewhere. Average weekly hours of “support activities for oil and gas operations’ employees peaked in March last year (Chart 4).
It is possible these companies are keeping the employees, but cutting hours, which makes sense given the decline in rig counts. This can also imply that they expect oil price to bounce back rather soon. The longer that does not materialize, the more the subsequent pain.

