
U.S. small-caps have had a phenomenal run post-election. From November 8 close through the intra-day all-time high 1392.71 on December 9, the Russell 2000 small cap index jumped 16.5 percent. It has come under slight pressure since that high, but nothing major – not yet anyway.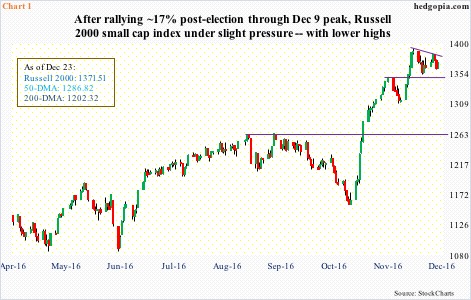
The Russell 2000 is still above immediate support at 1347 (Chart 1). This likely gets tested near term. Since the afore-mentioned record high early this month, it now has lower highs. The post-election momentum that ultimately pushed the index past the prior high of June 2015 looks to be itching to rest – at least near- to medium-term. Bears would score victory if they could push the index below the 10- and 20-day moving averages, which are now dropping to flattish.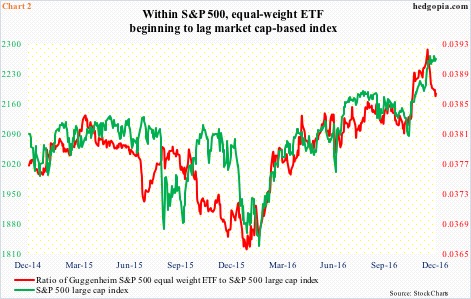
One sign of subtle under-the-surface deterioration can be seen in the ratio of RSP, the Guggenheim S&P 500 equal weight ETF, to the S&P 500 large cap index.
As the name suggests, RSP takes all the stocks in the S&P 500 and weights them equally. The S&P 500, on the other hand, is market cap-weighted.
The top five weights in the S&P 500 are assigned to Apple (AAPL), Microsoft (MSFT), Exxon Mobil (XOM), Johnson & Johnson (J&J), and Berkshire Hathway B (BRK.B), in that order. AAPL’s weight is 3.13 percent in the S&P 500, but only 0.21 percent in the equal-weight index.
The ratio between the two peaked on December 8, even as the S&P 500 peaked three sessions later (on December 13 at 2277.53). Since then, the red line in Chart 2 has decidedly turned lower, yet the S&P 500 is not that far away from its record high. In the latter, large-caps apparently are holding the fort.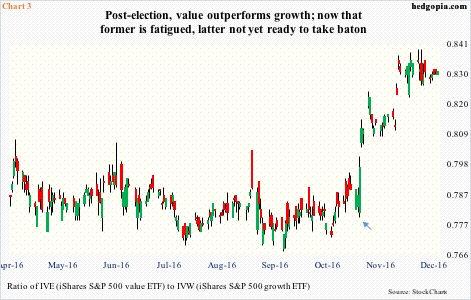
There is a similar dynamic in play elsewhere.
Chart 3 plots a ratio of IVE, the iShares S&P 500 value ETF, to IVW, the iShares S&P 500 growth ETF.
First a little primer on these two ETFs.
IVE’s top five sector exposure is made up of financials (26.9 percent), energy (12.5 percent), consumer staples (11.6 percent), health care (11.4 percent), and industrials (8.7 percent). Information technology only comprises 6.8 percent.
IVW’s top five consists of info tech (33.3 percent); consumer discretionary (16.7 percent), health care (15.4 percent), industrials (11.7 percent), and consumer staples (7.3 percent).
Post-election, both IVE and IVW rose, but the former disproportionately so. Hence the sharp rise in the ratio in Chart 3 (arrow). Apparently, money rotated into value, away from growth. Financials, energy, and industrials rallied big, even as tech lagged.
For those with valuations focus, at 25x P/E and P/B of 5.11, IVW remains grossly expensive. With the recent rally, IVE now trades at P/E of 17.7 and P/B 2.04.
This is probably why IVE:IVW is sideways to slightly down from early this month. Post-election high-fliers such as XLF, the SPDR financial ETF, is itching to go lower, even as money hesitates to aggressively move back into tech. It was not until December 13 the Nasdaq 100 surpassed its previous high of 4911.76 (reached on October 25). By then, other major U.S. indices were scoring one after another high.
And that is the problem immediate ahead. Post-election winners are giving out signs of fatigue, even as other sectors are not stepping up to take the baton.
Thanks for reading!
