In the wake of the Fed’s hawkish tilt last week, tech came under pressure, though nothing major yet. This is taking place even as some internals are showing cracks.

The Nasdaq 100 tumbled 3.3 percent last week. This was a week in which the interest-rate outlook changed meaningfully. Not only did the Fed aggressively dial back its bond buying but projected three rate hikes next year. Beginning January, it will reduce the monthly buying to $60 billion. Until recently, it bought $120 billion worth every month.
The tech-heavy index supposedly sold off because investors are fearing higher rates would hurt growth. Be that as it may, the fed funds rate has been zero-bound since March-April last year. Rising rates are not necessarily a bull killer. We can see this in past tightening cycles (Chart 1).
The problem starts when higher rates begin to adversely impact the economy.

It is too soon to fear that.
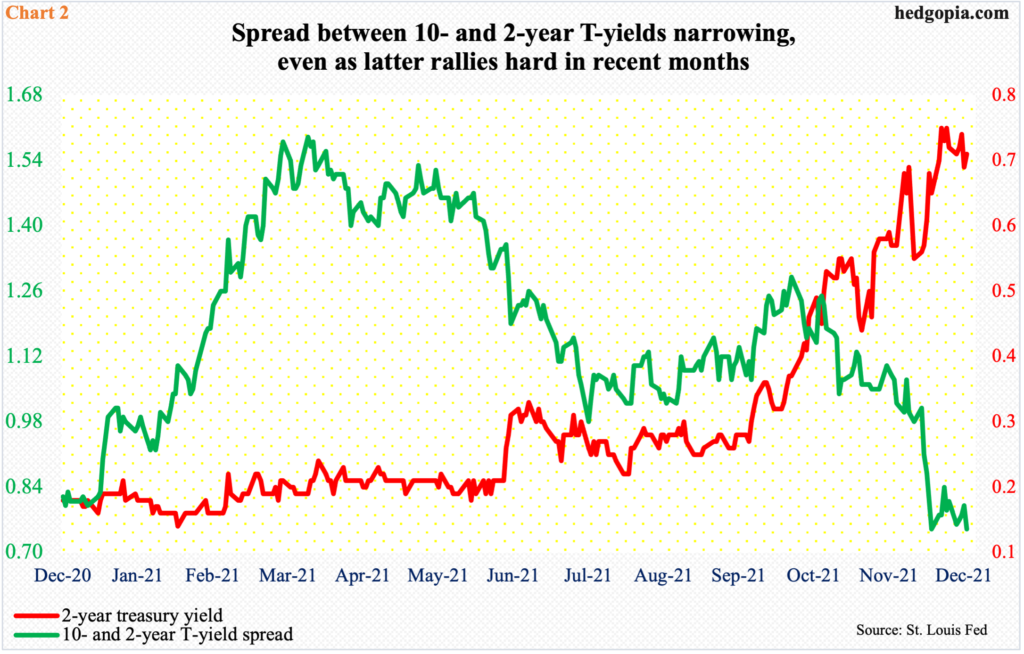
That said, the spread between two- and 10-year treasury yields is beginning to contract. Two-year yields tend to be the most sensitive to the Federal Reserve’s expected monetary policy.
Until three months ago, two-year notes were yielding in the low 0.20s. Last Friday, yields were 0.66 percent. During the period, the 10-year (1.40 percent) was essentially flat to slightly higher. As a result, the spread between the two is narrowing (Chart 2). The spread is nowhere near inversion, but at least some are beginning to believe that higher short rates may ultimately hurt the economy and that this would put long rates under pressure.

Tech bulls are sitting on tons of gains. From the low of last March through the record high on the 22nd last month, the Nasdaq 100 shot up 148 percent. So, it is tough to tell if last week’s selling is the beginning of something nasty or just minor profit-taking.
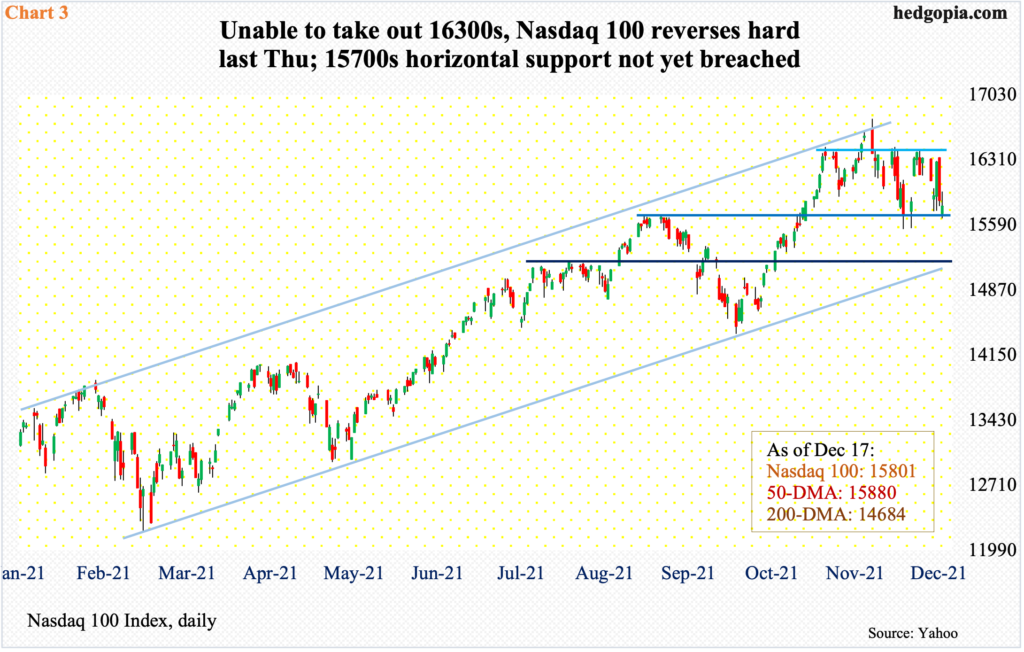
Last week, the FOMC concluded its meeting on Wednesday. Until Thursday’s high of 16341, the Nasdaq 100 was up 0.1 percent for the week but reversed lower in the opening minutes to end the session down 2.6 percent. Come Friday, it dropped another 0.4 percent; the 50-day (15880) was compromised, albeit slightly.
Bulls can draw solace in the fact that except on Monday bids showed up at 15700s horizontal support in the remaining four sessions. A loss of this support could expose the Nasdaq 100 (15801) to a drop toward 15100s (Chart 3).

In the grand scheme of things, last week’s selling is miniscule. But this could just be the start of more to come. Time will tell. What we do know is that subtle cracks are showing up in some internals. Once again, the deterioration is not major right here and now but has the potential to be.
That the top six or seven stocks – all tech – have an outsized influence on major market cap-weighted indices such as the Nasdaq 100 and the S&P 500 is well known. The likes of Apple (AAPL) and Microsoft (MSFT) are not much off their record highs.
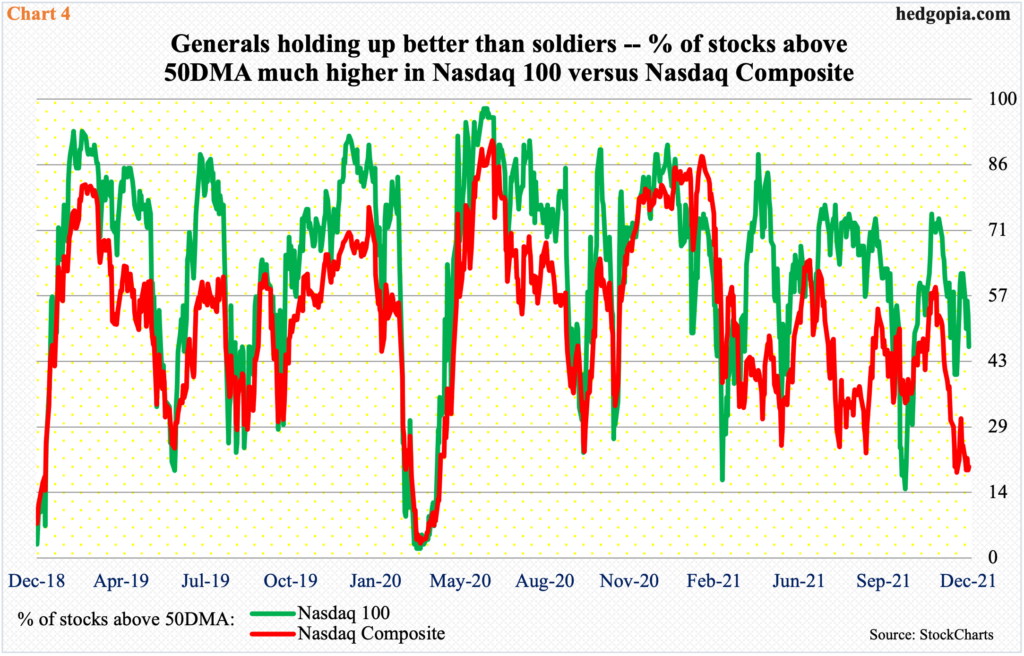
In fact, the generals are holding up much better than the soldiers. Last Friday, 46 percent of Nasdaq 100 stocks were above their 50-day. This is much better than a comparative 20 percent for Nasdaq (Composite) stocks (Chart 4). If past is prelude, the gap as wide as it is, tends to fill sooner or later.

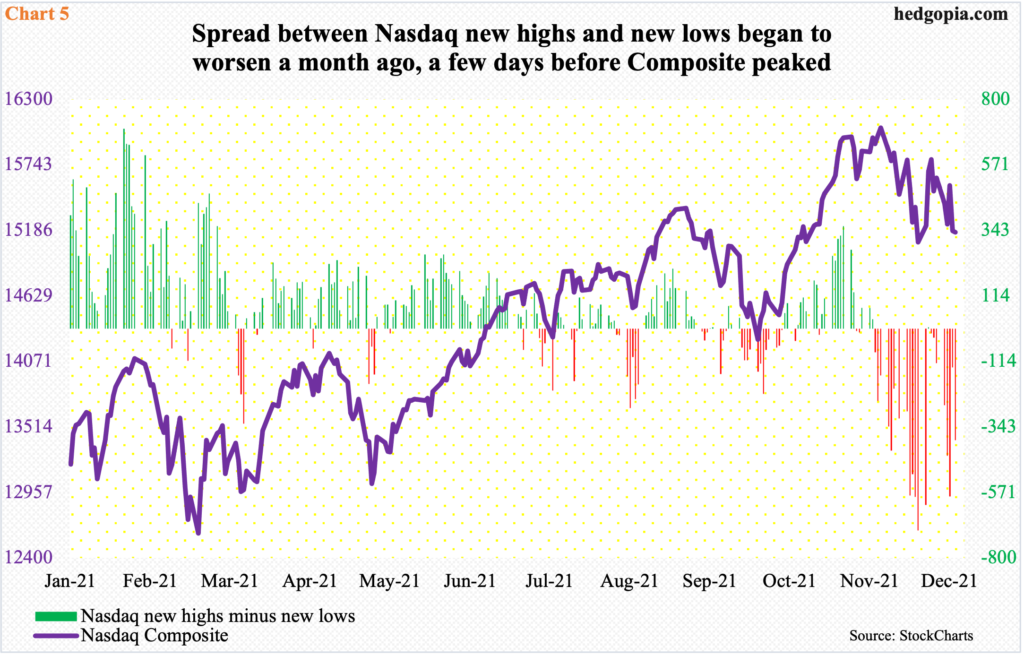
Concurrently, within the Nasdaq Composite, new 52-week lows are overpowering new highs. The index peaked on November 22. On the 17th that month – three sessions ahead of the peak in the index – the spread between new highs and new lows went negative, and except for one session on the 7th this month, has remained in the minus column (Chart 5). During the period, the index put in a bottom on the 3rd (this month) and rallied nicely. But the red histograms in Chart 5 has remained that way.
Equity bulls would much prefer this metric improved – the sooner the better. The longer it takes, other metrics begin to deteriorate. That is the risk facing them. As Chart 3 shows, the Nasdaq 100 is clinging on to support, and a breach would open the door to a test of lower support, which is where months-long channel support lies.
Thanks for reading!

