
If there was any doubt that short interest played a key role in the rally since September 29th, the latest short interest data should settle it.
That said, since short interest remains elevated, the debate is still open as to if if equity bulls have the wherewithal left to continue to force a squeeze.
Thus far, shorts have paid for their excessive pessimism.
On substance, they were probably not wrong to have a bearish bias on stocks. Economic data continues to be tentative. And better-than-expected earnings are anything but…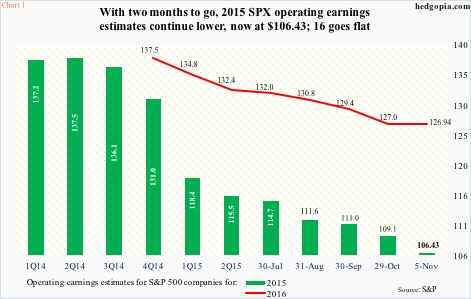
With 87 percent of S&P 500 companies reporting, 3Q operating earnings estimates slid further, to $24.93 (as of November 5th). They were $28.61 at the end of September. Estimates for the year have dropped from $110.98 to $106.43 during the period (Chart 1); 2015 is now on pace to dropping 5.8 percent over 2014. Next year’s estimates have come under pressure, but are expected to grow 19.3 percent, to $126.94 – probably way too optimistic.
No surprise, then, that shorts latched on to this, and other issues. Short interest spiked, in the end falling under its own weight.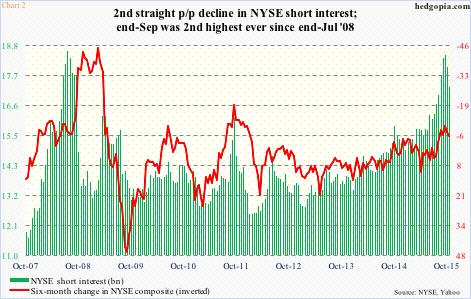
As of September 30th (one day after U.S. stocks bottomed), short interest on the NYSE Group shot up to the highest since the end of July 2008 (Chart 2). Since then, it has dropped 6.4 percent. During the period, the index rallied 6.8 percent. One look at the right side of that chart, and it is easy to see why equity bulls are salivating. In the right circumstances, there is plenty of room for the green bars to continue to shrink.
Over on the Nasdaq composite, it is the same story (Chart 3). End-September short interest was the highest since the middle of September 2008. The buildup is not as parabolic as on the NYSE, but directionally it is the same trend. In the past couple of periods, Nasdaq short interest dropped 4.5 percent, and the composite rallied 9.4 percent. Once again, if the trend sustains itself, this nothing but helps stocks.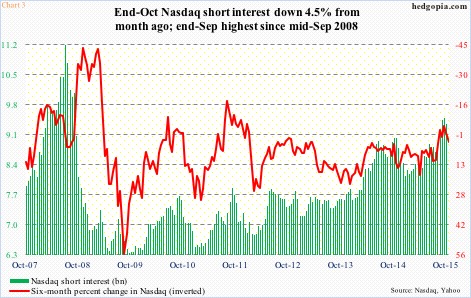
A lack thereof means what turned out to be a strong tailwind for stocks is fading.
Take a look at Chart 4.
From the end of March this year through the middle of September, short interest on SPY, the SPDR S&P 500 ETF, jumped 86 percent, to nearly 437 million shares. Then in the next month and a half, it dropped 36 percent, to the lowest since the end of April; the ETF rallied 5.3 percent during the period.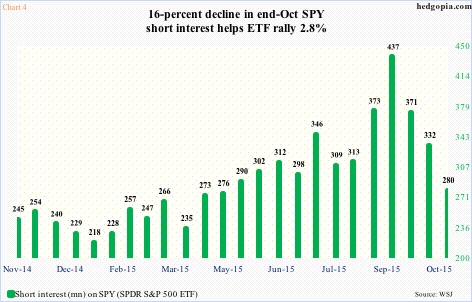
All that short-covering for a mere five-plus percent? It is probably not a wrong question to ask. If nothing else, it probably shows the rally was not combined with aggressive risk-on buying. This is despite the fact that money has increasingly gravitated toward large-caps, and less so toward mid- and small-caps.
This phenomenon is evident across sector ETFs, as well as a few others.
Chart 5 charts percent change in short interest on several ETFs over the past couple of periods, and it is a sea of red, with some showing substantial drop in short interest.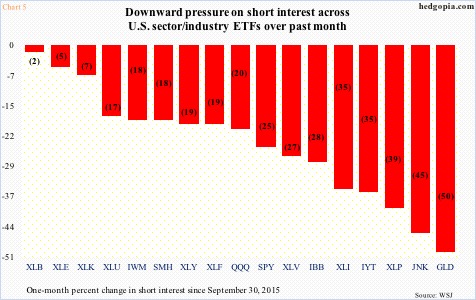
Secondly, staying with SPY for a moment, in the September 30th-October 15th period, it rallied 5.6 percent, even as short interest dropped 10.6 percent. In the October 15th-October 30th period, the ETF only rose 2.8 percent, while short interest declined 15.8 percent. Once again an example of equity bulls unable to utilize short-covering to the fullest extent possible. The probable explanation? In the September 30th-October 15th period, the then 12-percent drop in the ETF attracted fresh money, while the October 15th-October 30th period was primarily driven by short-covering.
And that is the problem facing the bulls – potential fuel for rally is not lacking, what is lacking is inflows, hence the ability to use short interest as tailwind for stocks.
Thanks for reading!
