
Georgia Senate results have pretty much ensured a new round of stimulus money as well as a fresh infrastructure package. Stocks had a massive 4Q, with the S&P 500 jumping 11.7 percent. This helped push the price-to-sales ratio further into uncharted territory.
Stocks were strong last week, particularly small-caps, which fortunes are tied more to the domestic economy than their larger-cap peers. The Russell 2000 small cap index shot up 5.9 percent for the week. Investors sought more small-cap exposure after Democrats won both Georgia Senate runoff elections, giving them control of both chambers of Congress as well as the White House. The bond market immediately rerated inflation/growth expectations, with the 10-year treasury yield jumping 19 basis points to 1.11 percent.
Both equities and bonds seem increasingly confident that president-elect Joe Biden would be able to push through a big stimulus package, followed by an infrastructure package. After December’s weaker-than-expected jobs report, a new stimulus bill is expected to sail through in Congress as soon as the new administration begins on the 20th this month.
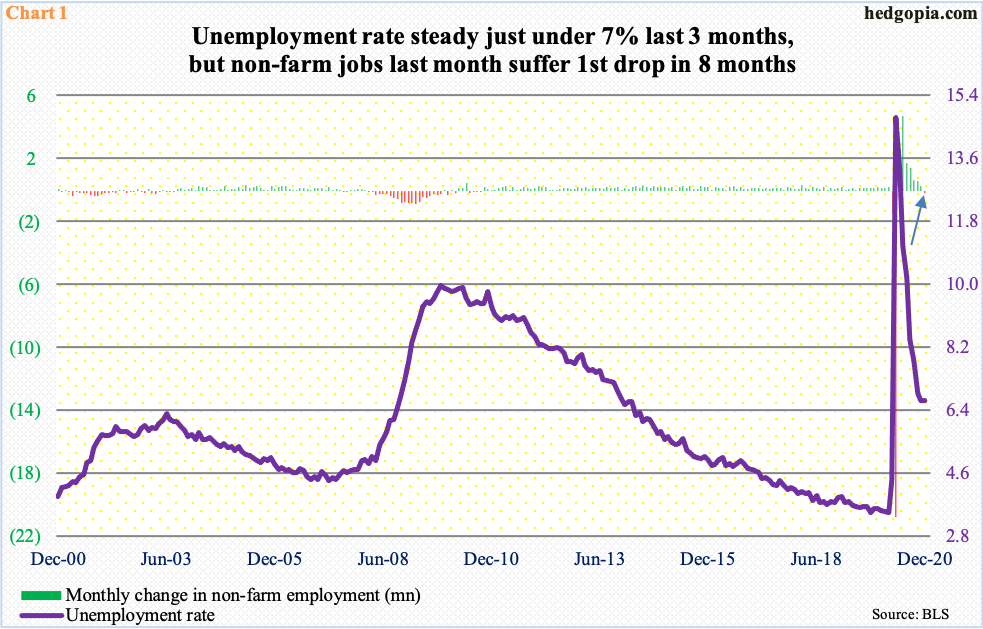
In December, the US economy lost 140,000 non-farm jobs to 142.6 million. This was the first monthly loss in eight months (arrow in Chart 1). From April’s low, 12.3 million jobs have been created, but from February’s high of 152.5 million, there are still 9.8 million fewer jobs. This makes the case of more stimulus stronger.
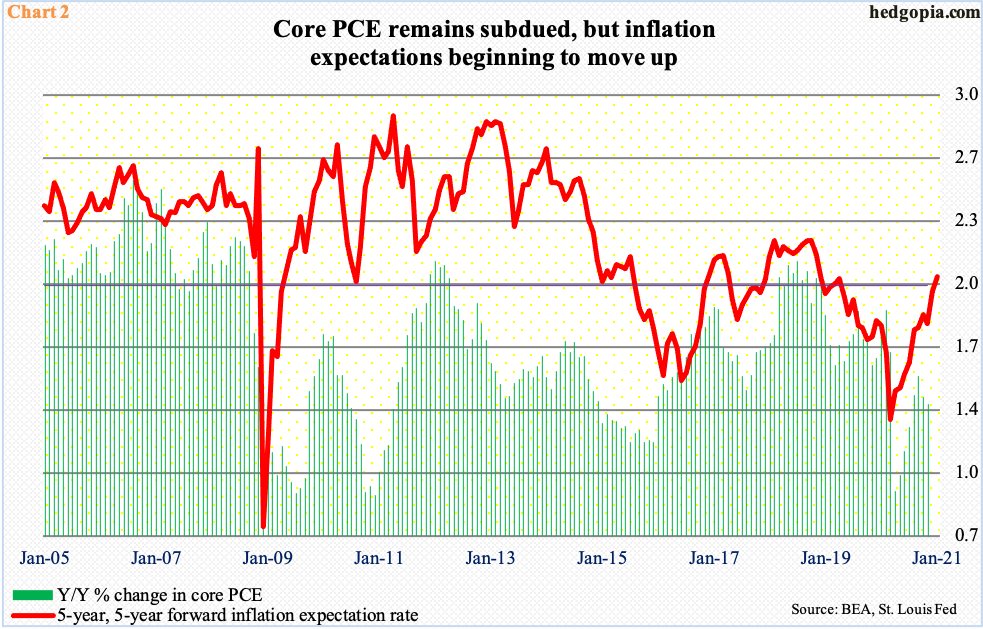
Reflation trades are getting a new lease of life, so to speak. Markets are beginning to sniff inflation. The five-year, five-year forward inflation expectation rate just crossed two percent – the first time it has done so since April 2019.
Inflation expectations have trended higher since last April (Chart 2). In that month, core PCE (personal consumption expenditures), which is the Fed’s favorite measure of consumer inflation, bottomed as well, at 0.93 percent, but it is still meaningfully below the two percent threshold, with November at 1.4 percent. The last time core PCE grew with a two handle was in December 2018.
Against this backdrop, inflation expectations are beginning to perk up. It is nowhere near alarming now but can be if the trend persists.
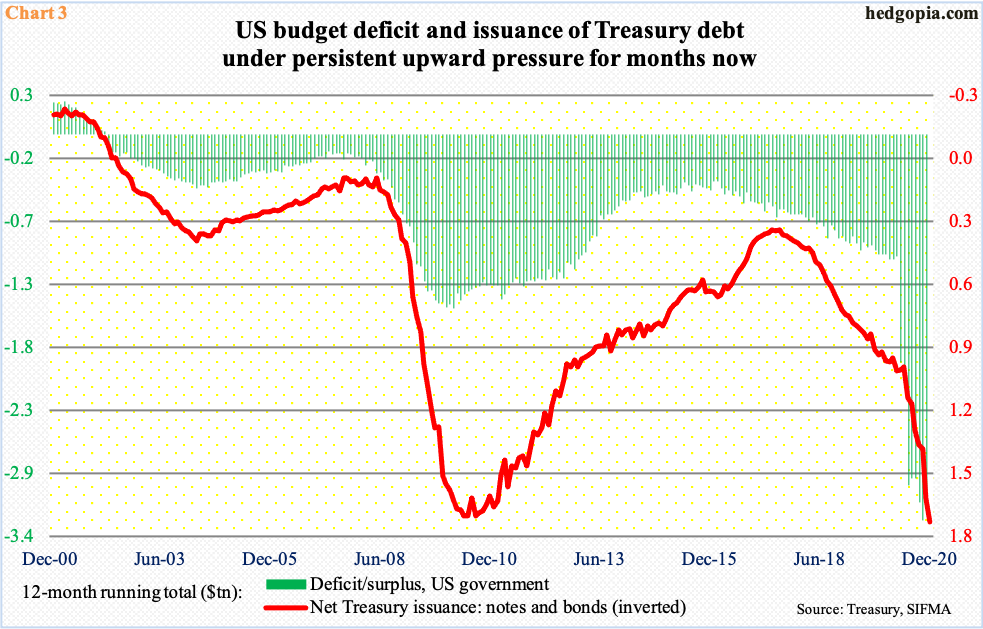
With additional stimulus and spending plans, the budget deficit is all set to continue trending higher. From the red ink perspective, things are already bad and will get worse before it gets better. This will obviously mean more issuance of debt (Chart 3). The Fed has been aggressively accumulating treasury securities.
Speaking to the press at the end of the December 15-16 FOMC meeting, Chair Jerome Powell said the central bank would adjust its quantitative easing program if the need be but for now would purchase at least $120 billion/month in US treasury bonds and mortgage-backed securities. At this rate, the central bank is on pace to holding $6.8 trillion in these securities in six months. Equity bulls are excited about all this liquidity. The focus is not on the rather unsustainable path of the deficit – at least not now.
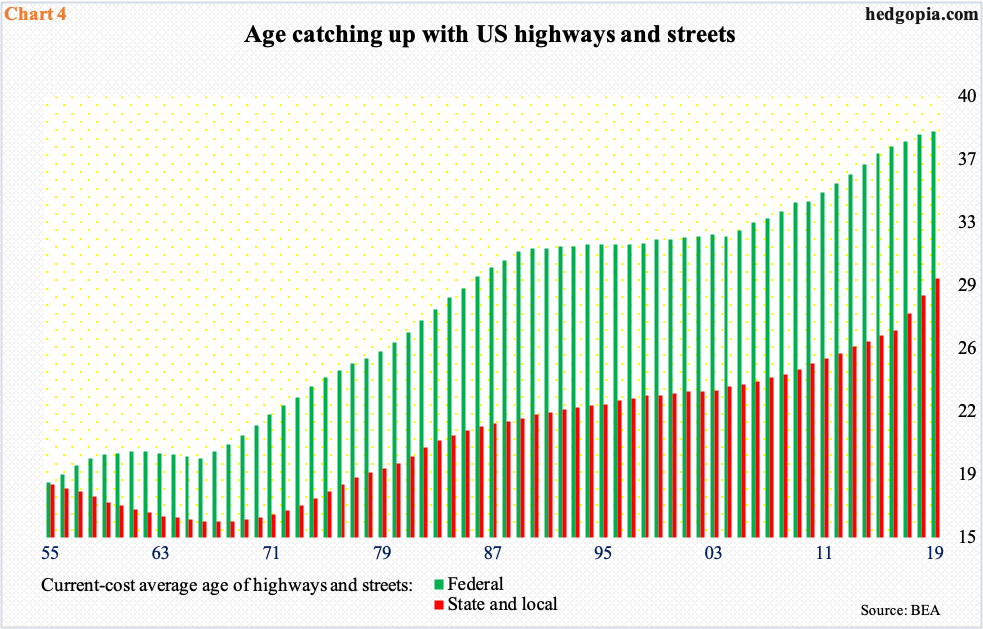
Post-Georgia election results, odds of a big infrastructure package have meaningfully gone up. The nation’s infrastructure needs investment. There are no ifs, ands, or buts about it. Chart 4 is just an example.
Over the years/decades, the average age of US highways and streets – both federal and state/local – has persistently risen. This is true with bridges, airports, and so on.
With federal debt north of $27 trillion and the budget deficit soaring, it is hard to come up with a big infrastructure package that could please both sides of the aisle in a divided government. The Biden administration will not be shackled by this.
The president-elect likely will ask Congress to pass $1,600 for Americans – the balance of $2,000 after accounting for the $600 recently doled out – and then go for infrastructure spending that could run in at least a couple of trillion dollars.
This obviously will reverberate through the economy – in a positive manner.
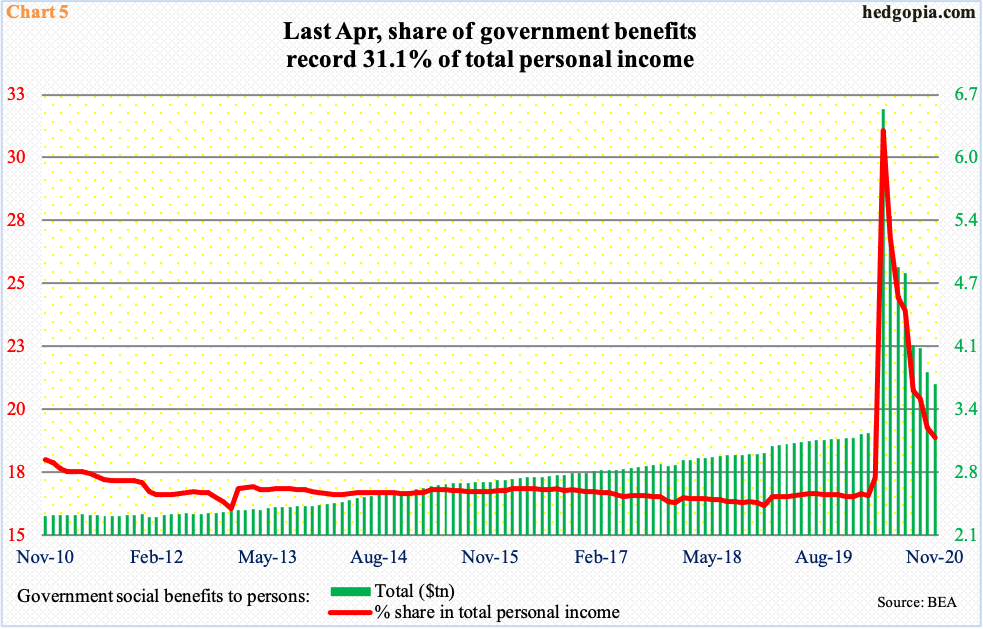
The CARES Act (Coronavirus Aid, Relief, and Economic Security Act), which provided monetary assistance of up $1,200/individual, was signed into law on March 27 last year. Back then, the ‘government social benefits to persons’ category stood at a seasonally adjusted annual rate of $3.2 trillion. This then shot up to $6.6 trillion in April, making up 31.1 percent of total personal income (Chart 5).
Of the six constituents, social security, Medicare, Medicaid, and veterans’ benefits saw normal growth. The other two – unemployment insurance and ‘other’ respectively jumped from $74.4 billion in Mar to $1.4 trillion in June and from $515.2 billion in March to $3.4 trillion in April; in November, they were $277.4 billion and $632.4 billion, in that order.
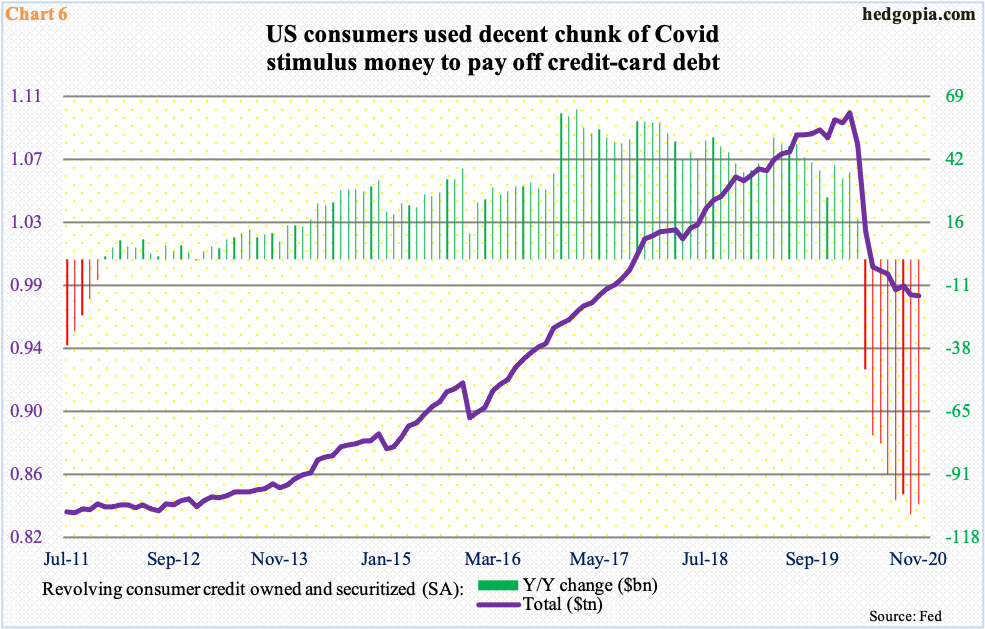
Interestingly, consumers seemed to have used a decent chunk of the stimulus money in paying off their credit-card bill.
First of all, they are up to the gills in this type of leverage. Five years ago, in December 2015, they owed $898.7 billion in revolving credit, which, as opposed to non-revolving credit such as mortgage loans, car loans, or student loans, does not come with a fixed number of payments. By last February, revolving credit had surged to $1.1 trillion. Then, it began dropping. Last November, it hit $978.8 billion in November, down $104 billion from a year ago (Chart 6). This was the eighth consecutive y/y decline. The last time consumers cut back on borrowing was nine years ago.
The current trend is good from the perspective of excessive leverage but not for the economy, which is increasingly reliant on debt.
If Americans again end up using the new round of stimulus money in paying off debt, their balance sheet improves but the economy does not get the desired positive effect.
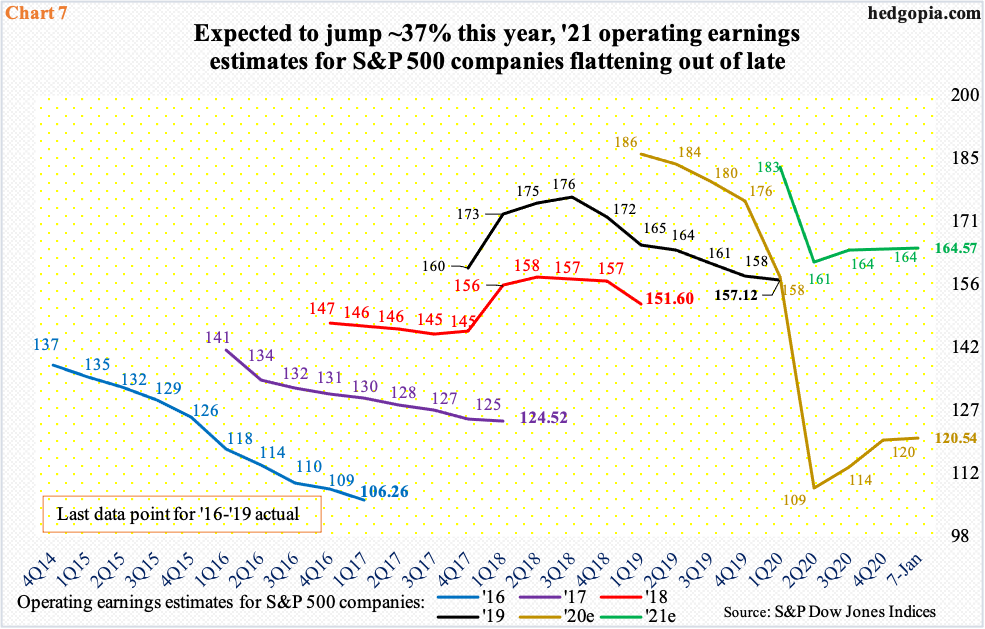
Post-Georgia results, as of last Thursday, the sell-side’s operating earnings estimates for S&P 500 companies were revised up $0.17 to $164.57. This week, these companies will begin to report results for the fourth quarter last year; if the expected $36.34 comes through, they will have rung up $120.54 for 2020, meaning earnings will have grown 36.5 percent this year.
Be that as it may, if past is prelude, the sell-side routinely lowers estimates as the year progresses (Chart 7). If stimulus money fails to have the desired effect on the economy, then earnings estimates in all likelihood face bigger downward revision risk.
Multiples are already stretched. Using trailing 12 months, the S&P 500 traded at a price-to-earnings ratio of 31.2x at the end of last year. On a forward basis, it drops to 23.2x, but is still elevated.
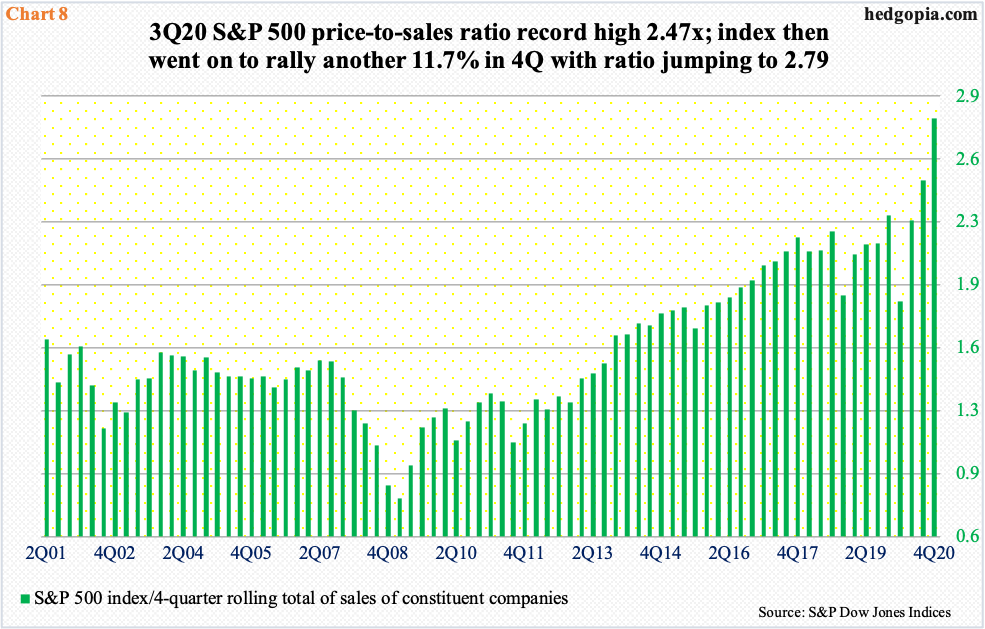
On a related note, the price-to-sales ratio on the S&P 500 finds itself in uncharted territory.
At the end of 3Q20, the ratio rose to a new high 2.47x. In 4Q, the S&P 500 jumped 11.7 percent; the ratio shot up to 2.79x. The message in this is that crazy can always get crazier. Stocks were reacting to the November 3 presidential election and to positive vaccine news from Pfizer (PFE) and Moderna (MRNA) in November.
Equities currently are in the midst of tons of crosscurrents, pricing in plenty of optimism. Increasingly, we are beginning to hear investor sentiment that stocks have permanently shifted to a higher plateau. The argument that there is plenty of liquidity sloshing around in the system and that the Fed put is at work has truth to it. What is not known is the extent to which this is in the price.
Hence the importance of Chart 8, where the bars are so tall the law of gravity can begin to work any time. It is something to keep on the back of one’s mind.
Thanks for reading!
