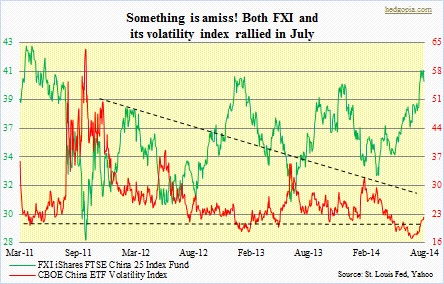
 Following up with the piece yesterday, the adjacent chart offers some interesting insight into the direction the FXI might take in the days and weeks ahead. The Chicago Board of Exchange applies its VIX methodology to create indexes reflecting expected volatility for options on selective ETFs. The CBOE China ETF Volatility Index reflects the implied volatility of the FXI. The data only goes back to March of 2011, but long enough to cover four serious selloffs in the ETF – 37 percent between mid-April and early-October of 2011, 21 percent between late-February and late-May of 2012, 25 percent between late-December 2012 and late-June 2013, and 19 percent between early-December 2013 and mid-March 2014. In each of these instances, volatility remains suppressed before thrusting higher. More often than not, the VXFXI has tended to trough around 21. Understandably, as it stabilizes and makes a move higher, the FXI comes under pressure. Interestingly, since the all-time high of 63.42 early-October 2011, the volatility index has progressively made lower highs, corresponding with higher lows in the FXI since that early-October 2011 low. This increases the odds of an explosive breakout down the road. It is just a matter of when. Most recently, the VXFXI made an all-time low of 16.93 on July 1st. That was when the FXI broke out. The latter went on to rally 10 percent in the next one month. But the VXFXI refused to go down, or even sideways. Rather curiously, it rallied, to 22-plus. It is not normal for both to rally simultaneously. Protection is being actively bought.

