QQQ bulls faced channel resistance a month ago, but defended channel support of different duration. They are, however, facing headwinds of waning momentum.
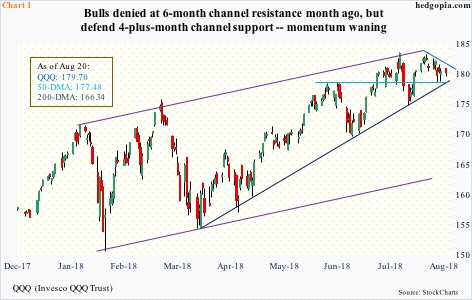
The bull-bear tug of war continues on QQQ (Invesco QQQ Trust). On July 25, bulls were rejected at six-month channel resistance (Chart 1). There have been subtle signs of fatigue since. Year-to-date, the Nasdaq 100 index (7371.42) is still way ahead of its major US peers. It is up 15.2 percent, versus 10.6 percent for the Russell 2000 small cap index, 6.9 percent for the S&P 500 large cap index and 4.2 percent for the Dow Industrials. The tech-heavy Nasdaq 100/QQQ has been a reliable go-to sector for a while. But of late they are lacking the kind of momentum they showed previously.
With that said, bulls have not stopped defending support. Late July-early August, bids persistently showed up at the 50-day moving average, followed by defense of near-term support last week at $178 on QQQ ($179.70). This also approximates a rising trend line from early April. Hence its significance. Odds favor a breach soon. On the weekly chart, the MACD is on the verge of a potentially bearish cross-under. Once this support goes, QQQ likely comes under decent selling pressure.
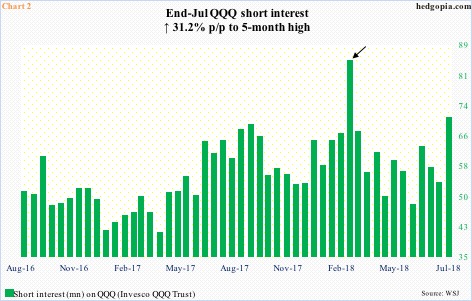
In this scenario, as much as the bulls would cherish one, short squeeze does not look probable – at least not yet. At the end of July, QQQ short interest jumped 31.2 percent period-over-period to 70.1 million shares. This was the highest since 84.6 million mid-February (arrow in Chart 2). Late January-early February this year, US stocks, including QQQ, came under severe pressure. The ETF bottomed on February 9. Shorts lent a big helping hand in the rally that followed, as they got squeezed big time. By the end of May, short interest fell to 47.8 million. Once again, it is building up. This is an opportunity for the bulls if they can force a squeeze. But, as previously mentioned, it increasingly looks like they are running out of ammo right here and now. What the rather elevated short interest can do is not let selling get out of hand, as shorts get tempted to lock in profit.
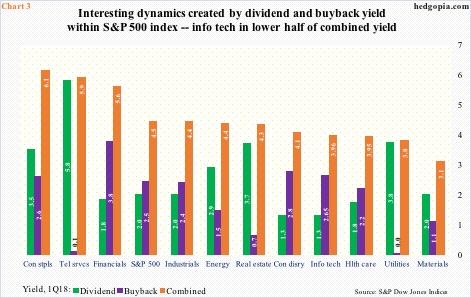
The rather lethargic action in QQQ is coming at a time when info tech is falling behind sector peers from the yield viewpoint. Chart 3 uses both dividend and buyback yield for 11 S&P 500 sectors. From the perspective of dividend yield, at 1.31 percent in 1Q18, info tech yields the lowest. This is not too surprising given, unlike defensives such as consumer staples and telecom, tech/biotech does not pay much in the way of dividends. That is not what investors gravitate toward this sector for in the first place. Buyback is different. The likes of Apple (AAPL) have been big buyers of their own shares. In the June quarter, the Cupertino, CA, company reported $20.8bn in repurchases, preceded by $22.8bn in 1Q. Of the total $189.1bn in S&P 500 buybacks in 1Q18, info tech accounted for $63.4bn. And it shows up in buyback yield, which in 1Q18 was a respectable 2.65 percent for the sector. Although on a combined basis, it yielded 3.96 percent in 1Q18, just above healthcare, materials, and utilities. As old as this cycle is – bull market completed nine years last March – this could increasingly become a factor in investing decisions and/or sector rotation.
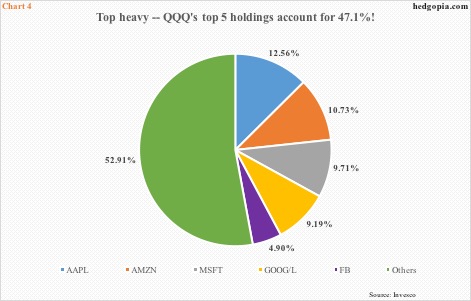
This is particularly so as the top few names inordinately dominate action in QQQ. The top five holdings – AAPL, Amazon (AMZN), Microsoft (MSFT), Alphabet (both class of shares) and Facebook (FB) – command 47.1 percent of the ETF.
Of the five, except for AAPL, the remaining four are beginning to show waning momentum on the weekly chart. FB in particular sold off huge on July 26 post-2Q earnings, and it remains under its 200-day. Selling pressure on these names can accelerate once QQQ loses the afore-mentioned trend-line support (Chart 1).
Thanks for reading!

