
QQQ made an all-time high last week, but failed at channel resistance. With the 2Q earnings season winding down, shorts may have better odds.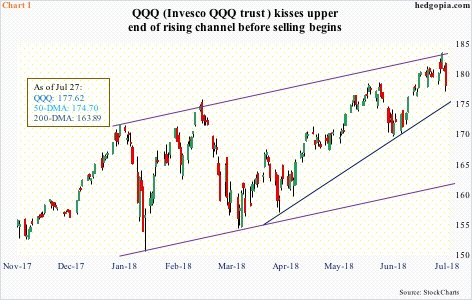
QQQ (Invesco QQQ Trust) hit a new all-time high of $182.93 last Wednesday. It has had quite a recovery since collapsing 12.2 percent intraday between January 26 and February 9. That is in 11 sessions! Since that low, it consistently made higher lows, and higher highs.
Last week’s high kissed the upper end of that rising channel, followed by a 1.4-percent drop Friday. It closed out the week at $177.62, four cents above the 20-day moving average. The 50-day lies at $174.70. At around $176 rests trend-line support from April. In the sessions ahead, a test of this support zone is likely, and in due course of the lower bound of the aforementioned channel – around $163, which approximates the 200-day at $163.89.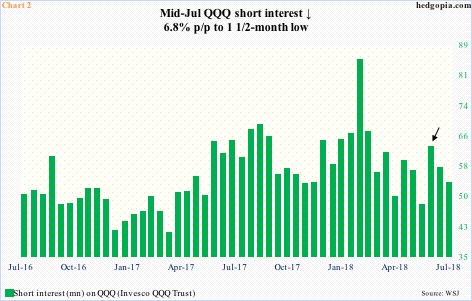
When QQQ bottomed in February, shorts were positioned neck-deep for continuation of weakness. Short interest on the ETF mid-February jumped 28.4 percent week-over-week to 84.6 million. Soon began short squeeze. By end-May, short interest had shrunk to 47.8 million, then rising to 62.6 million mid-June (arrow in Chart 2). The past couple of periods, short interest fell, and likely fell more in the current period as QQQ/Nasdaq 100 index rallied to yet another high.
As shorts cover, there is less and less squeeze tailwind, which is where things lie currently.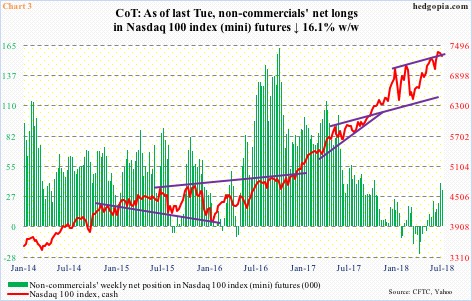
The February bottom in QQQ was also marked by non-commercials switching to net shorts in Nasdaq 100 index (mini) futures. In the week ended February 13, they switched from net long 12,492 contracts to net short 10,416 contracts. These were the most net shorts since June 2011. By the week ended April 24, these traders were net short 24,707 contracts. Then began the squeeze.
On April 25, QQQ made yet another higher low, before rallying (where dark blue trend line begins in Chart 1). Gradually, net shorts made way for net longs. However, once shorts got squeezed, longs showed less enthusiasm in aggressively building positions. The cash is near its all-time high, yet the green bars in Chart 3 are nowhere near prior highs.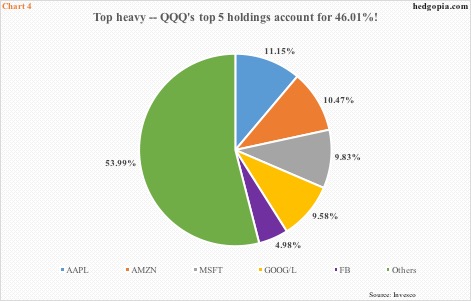
One major problem in the Nasdaq 100 has been narrow participation. Last Friday, 64 percent of Nasdaq 100 stocks were above their 50-day. In January, 90 percent were. Early April, this metric dropped to 10 percent, which laid the foundation for the rally that followed.
Just how narrow is the leadership? QQQ’s top five are Apple (APPL), Amazon (AMZN), Microsoft (MSFT), Alphabet (GOOG/L) and Facebook (FB). As of last Friday, they respectively accounted for 11.2 percent, 10.5 percent, 9.8 percent, 9.6 percent (both class of shares) and five percent, for a total of 46.01 percent. Of these five, APPL is the only one remaining to report 2Q (on deck Tuesday). Of the other four, FB was a massive disappointment, while results from the other three were received well. They have already enjoyed post-earnings bump.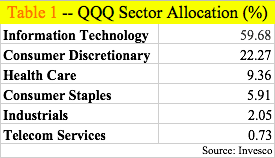
Information technology’s dominance in QQQ is also seen in Table 1. Nearly 60 percent of the ETF’s allocation goes toward the sector. Further, IT’s share would be substantially higher if AMZN were included in that sector instead of consumer discretionary. Any time a particular sector singlehandedly carries an ETF, risks rise. FB’s 19-percent post-earnings collapse last Thursday is an example of the built-in optimism.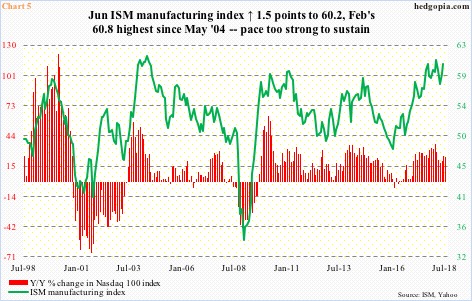
QQQ is facing channel resistance at at interesting juncture.
US manufacturing – as are most other macro data points – is currently very strong. In June, the ISM manufacturing index rose 1.5 points month-over-month to 60.2, not too far away from February’s 60.8 which was the highest since May 2004. As Chart 5 shows, it is not easy to sustain activity in the 60s. Mean reversion is the natural course of action. Activity can weaken in the second half.
If this scenario pans out, the Nasdaq 100 likely follows manufacturing lower. The red bars in the chart represent year-over-year change in the index, and tend to follow the ISM index.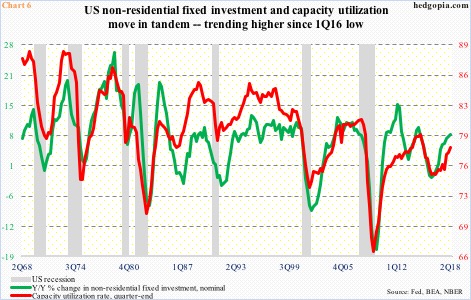
A similar signal may be coming from Chart 6. The first print last Friday showed real GDP grew 4.1 percent in 2Q18. This was the strongest growth rate in 15 quarters, and in fact could have been better had inventory depletion not subtracted a full percentage point. This at the same time could very well be the peak quarter for a while.
Unlike in past cycles, US capacity utilization this cycle retreated from 79.6 percent in November 2014, without reaching 80 percent, but has put up strong showing of late. Utilization reached 78 percent in June, up three percentage points from November 2016. A pause only makes sense. Utilization and y/y change in nominal non-residential fixed investment go hand in hand (Chart 6). A weak capex scene probably does not bode well for tech stocks.
Market participants could very well be beginning to anticipate this imminent shift in fundamentals, and are positioning accordingly. Once again, last week’s action on QQQ took place at important technical resistance. If the weekly chart in particular takes over, there is a long way to go on the downside.
As things stand, shorts may have better odds. Hypothetically, a short QQQ position can be combined with a covered put. Weekly (August 3) 175 puts bring in $0.86. This will help increase the short price to $178.48. If the underlying closes under $175 by expiration and the short option gets put, then it nets $3.48. Risk is if QQQ rallies beyond $178.48.
Thanks for reading!
