
Tech stocks outshone their peers last year.
In a year in which indices such as the S&P 500 large-cap index and Dow Industrials were negative – down 0.7 percent and 2.2 percent, respectively – the Nasdaq composite rallied 5.7 percent in 2015. The Nasdaq 100 did even better – up 8.4 percent. The Russell 2000 small-cap index had a lousy year – down 5.7 percent.
This year, stocks have gotten off to a bad start, with the S&P 500 and Dow Industrials each down 5.2 percent, the Nasdaq 100 down 5.7 percent, the Nasdaq composite down 6.4 percent and the Russell 2000 down eight percent.
Techs are giving back some of last year’s outperformance, although it is nowhere near as bad as small-caps.
The problem with tech’s outperformance last year was that it was led by just a few leading names – driven primarily by the likes of Facebook (FB), Amazon (AMZN), Netflix (NFLX) and Alphabet (GOOGL, formerly Google). The so-called FANG.
For tech-heavy indices in particular, this is a risk medium- to long-term, as the same names cannot be expected to again put up a banner year. Odds are simply stacked against that. That may be a reason why these indices are selling off in the first place.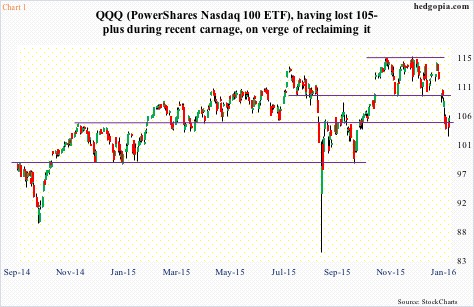
QQQ, the Nasdaq 100 ETF, surged to an all-time high as early as this last December, but had been going sideways, give and take, for months.
In the sell-off that began on December 30th, the ETF lost both its 50- and 200-day moving averages, as well as support at $105-and-change. The latter goes back more than a year (Chart 1). Monday produced a hammer, followed by a doji yesterday. The ETF ($105.54) is sitting right on that support-turned resistance. Near-term, odds of a rally are rising.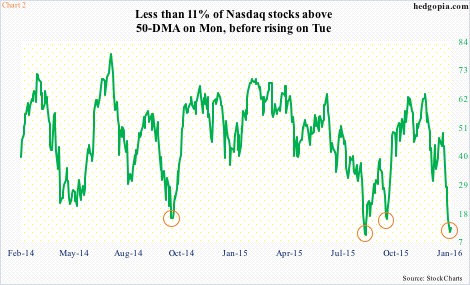
Chart 2 plots the percent of Nasdaq stocks above the 50-day moving average, and it is darn low – less than 11 percent on Monday. The prior three circles in the chart indicate important bottoms – mid-October 2014, late-August 2015, and late-August 2015. The spring is compressed.
Non-commercials are yet to start aggressively getting net long Nasdaq 100 index (mini) futures. They are net long, but have been cutting back particularly since early November last year. As of Tuesday last week, they held nearly 36k contracts, down 41 percent week-over-week (Chart 3). That was prescient. In the week ended yesterday, the index lost 3.5 percent. It is possible this, combined with the price action Monday, has coaxed these traders into adding longs. We will find out this Friday.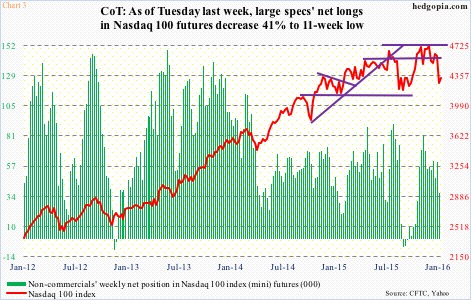
Either way, the index/ETF remain grossly oversold on a daily chart – ready for a sharp countertrend rally in the right circumstances.
Back in late September last year, the bears helped propel the rally in the Nasdaq 100. By mid-September, short interest on QQQ had surged to just under 72 million – the highest since the end of October 2014. This time around, it had been building since the end of October last year, but declined 10 percent in the latest period. The potential short-squeeze fuel is nowhere near the mid-September high (Chart 4). That said, should a rally ensue in the Nasdaq 100, there is room for a mini-squeeze.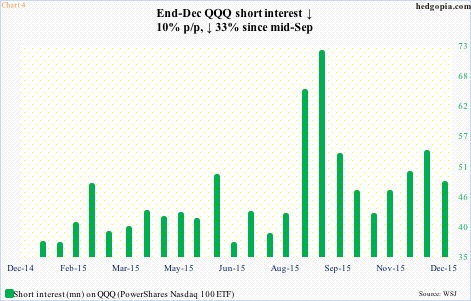
Under this scenario, a short put can help.
Hypothetically, January 22nd 104.50 puts fetch $1.35. If put, it is a long at $103.15. The intra-day low on Monday was $102.73.
Thanks for reading!
