
Sales of existing homes collapsed 10.5 percent month-over-month in November, to a seasonally adjusted annual rate of 4.76 million units. This was the first time since February this year sales came in below five million. November sales were nearly 15 percent below July’s 5.58 million, which were the highest since 5.79 million in February 2007 (Chart 1).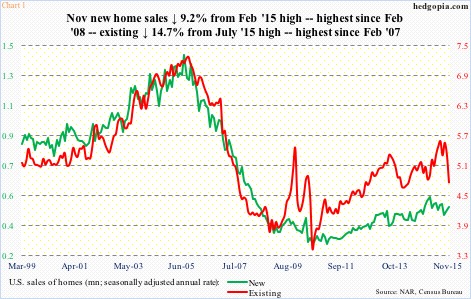
The downward momentum in sales of new homes is not as stark, but things no doubt are decelerating. Sales peaked in February this year at a seasonally adjusted annual rate of 545,000 units – the highest since 593,000 in February 2008. November sales were 10.1 percent off the high early this year.
Is momentum running out?
It is probably too soon to conclude that, but price has definitely not helped matters.
The median price of an existing home spiked to $236,300 in June this year, surpassing the bubble high $230,400 of July 2006. As stated earlier, sales peaked in July this year – one month after price peaked.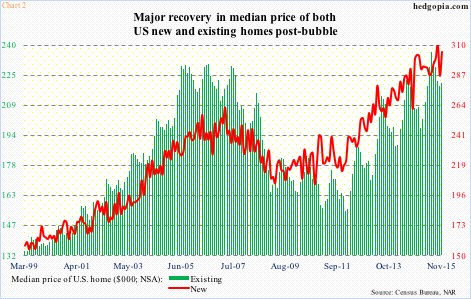
New homes, on the other hand, witnessed a much faster recovery in price. The median price surpassed the bubble high $262,600 (March 2007) as early as February 2013, and has remained elevated since (Chart 2). In November last year, it reached $302,700, before coming under slight pressure. Sales peaked in February this year. September has now been revised higher to an all-time high $310,400, with November not that far behind at $305,000.
Off the recent all-time highs, the median price is off a mere 1.7 percent for new homes and 6.8 percent for existing. Not much of a drop to potentially act as a tailwind, come to think of it.
Thus far, the deceleration in sales has not dented builder sentiment in any meaningful manner.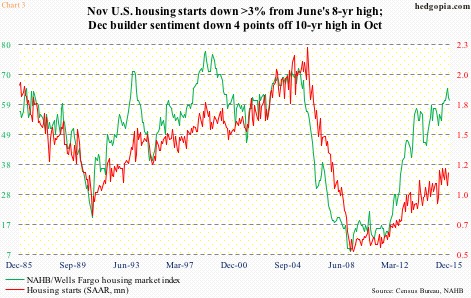
The NAHB (National Association of Home Builders)/Wells Fargo housing market index dipped to 61 this month, but reached 65 in October, a 10-year high (Chart 3). As a matter of fact, builders of late have been putting their money where their mouth is.
Housing starts (SAAR) have come in north of a million units for eight straight months, with November rising 10.5 percent, to 1.17 million units. The 12-month rolling average was 1.1 million in November – the highest since June 2008.
That said, builders have also not been going all-in when it comes to breaking ground on new construction. There is still a wide gap between the green and red lines in Chart 3.
In the aggregate, housing is just muddling along.
Builder sentiment is ebullient, but at the same time construction remains relatively subdued versus days leading up to the bubble a decade ago. Consequently, supply is relatively tight. In November, months’ supply was 5.1 in existing homes and 6.8 in new homes. (Although supply of new homes was as low as 4.2 in April this year.) This helps push up prices, which in turn has to be increasingly providing a sales headwind.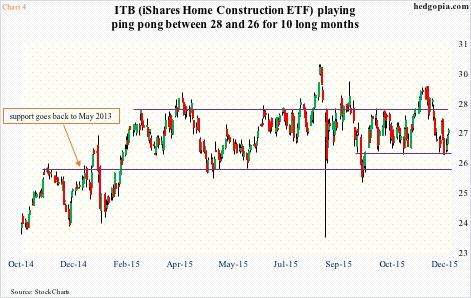
Nowhere is this muddle-through better reflected than in ITB, the iShares Dow Jones U.S. Home Construction ETF ($27.40). It has been range bound between $26-26.50 and $28-28.50 – for nearly a year now (Chart 4).
The ETF just bounced off the lower end of its range. Daily conditions are oversold, with room to push up toward the upper end of the range. But first, it has to rally past both its 50- and 200-day moving averages, which are right above.
Should that take place, given where housing is, it is hard to imagine ITB breaking out. If anything, it might be a short candidate. Wait and watch for now.
Thanks for reading!
