Interest rates on both the short and long end have gone up meaningfully. The federal government sits on nearly $33 trillion in debt, and the budget deficit is on the rise even though the economy is growing. This only means persistently rising interest payments.

US interest rates have come a long way.
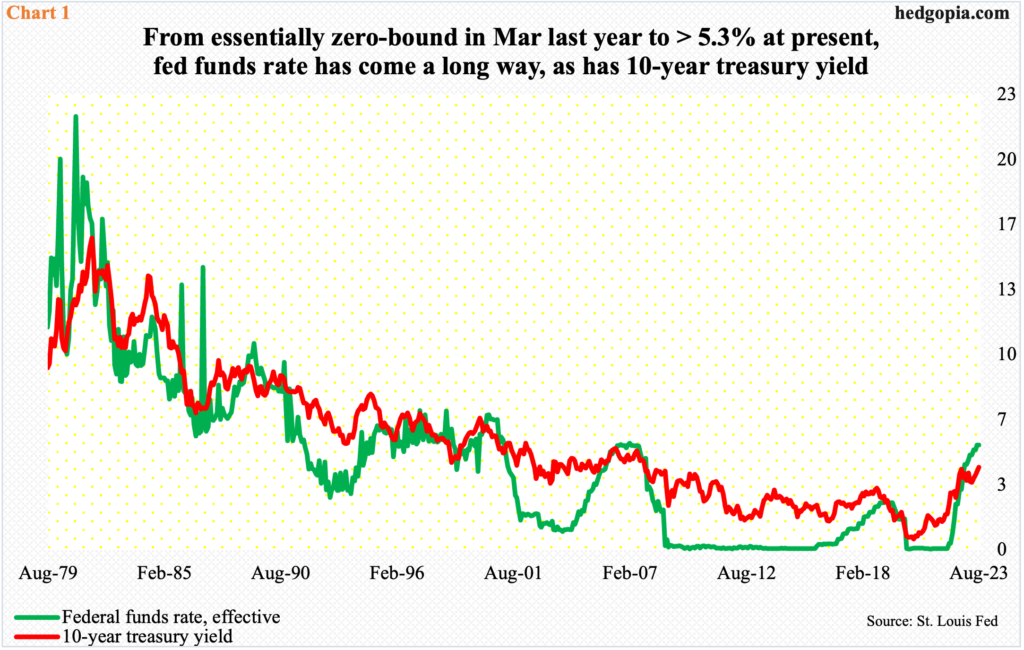
In March last year when the Federal Reserve began its tightening campaign, the fed funds rate was between a range of zero and 25 basis points – left there for a couple of years post-Covid economic disruptions. The 10-year treasury yield was around 1.7 percent back then, having bottomed at 1.13 percent earlier in July and August 2021 and even earlier in March 2020 at 0.4 percent.
Nearly 17 months later, the fed funds rate was last month raised to a range of 525 basis points and 550 basis points (Chart 1). The central bank likely moves one more time before it calls it quits, leaving the benchmark rates elevated for an extended time.
The 10-year yield, in the meantime, ticked 4.33 percent last October before coming under pressure and bottoming at 3.25 percent in April; Thursday, it broke out of horizontal resistance at 4.09 percent to close at 4.19 percent. The October high is now worth watching.
On both the short and long end, rates have meaningfully moved up.

In the futures market, traders continue to bet that the fed funds rate has already peaked and that the Fed would begin to cut as early as next March or May, ending 2024 between 400 basis points and 425 basis points. For the Fed to lower rates by 125 basis points to 150 basis points, the economy will probably need to massively decelerate from here or even enter recession. The 10-year is not buying this scenario.
These notes are under pressure, and yields are rising. This is taking place at a time when the budget deficit is going through the roof. Conceivably, even if fed funds futures turn out to be right in their economic pessimism, the 10-year could be simply reacting to supply-demand dynamics.
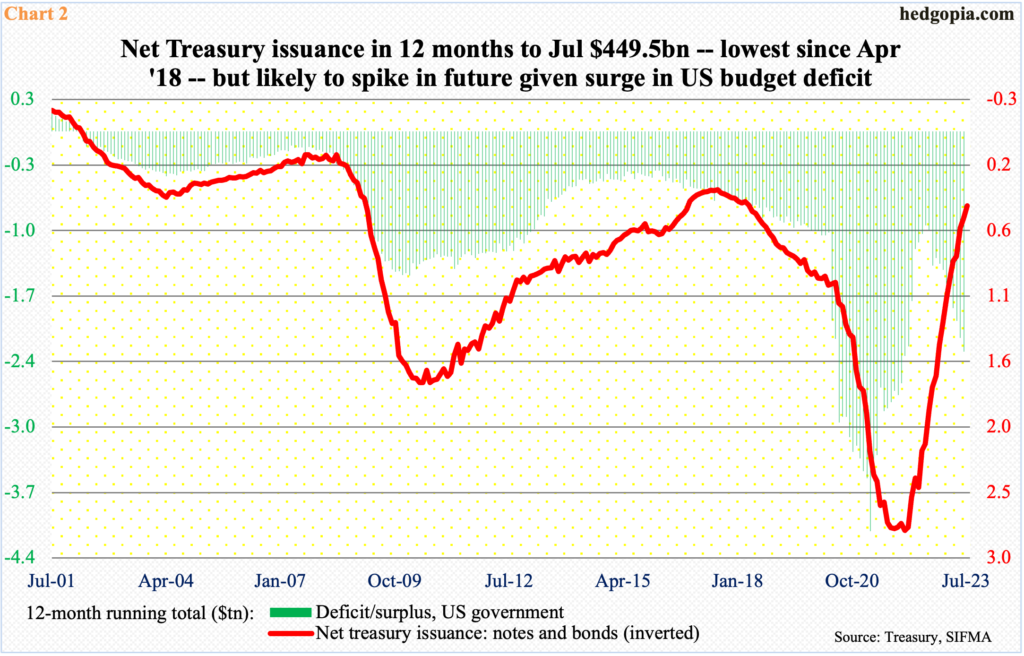
In the 12 months to June, the US government ran a deficit of $2.3 trillion. This at a time when the economy is growing at a decent clip. The red ink has gone straight up from July last year when it troughed at $961.7 billion (Chart 2).
In the chart, the red line, which represents net issuance of treasury notes and bonds and is inverted, has a lot of catching up to do, and it is coming. In the 12 months to July, net issuance was merely $449.5 billion, having peaked at $2.8 trillion in January last year. Currently, the red line has diverged with the green bars, with the latter already spiking.
An increasing supply of treasury securities will be needed to fund the deficit. As a matter of fact, the Treasury this week meaningfully lifted its borrowing forecast for the current quarter to $1 trillion, versus its May forecast of $733 billion.

This has the potential to put upward pressure on rates.
Importantly, the Fed, which aggressively bought treasury and mortgage-backed securities to more than double its balance sheet between March 2020 and April 2022 to just under $9 trillion, has been reducing its asset base by nearly $100 billion a month. As of Wednesday, it held $4.3 trillion in treasury notes and bonds, down from a peak of $4.9 trillion in April last year.
The dearth of a reliable buyer for these securities will reverberate through prices. At least that is the thinking behind the current rally in treasury notes and bonds (for the uninitiated, price is inversely related to yield).
How this gets resolved is anyone’s guess.
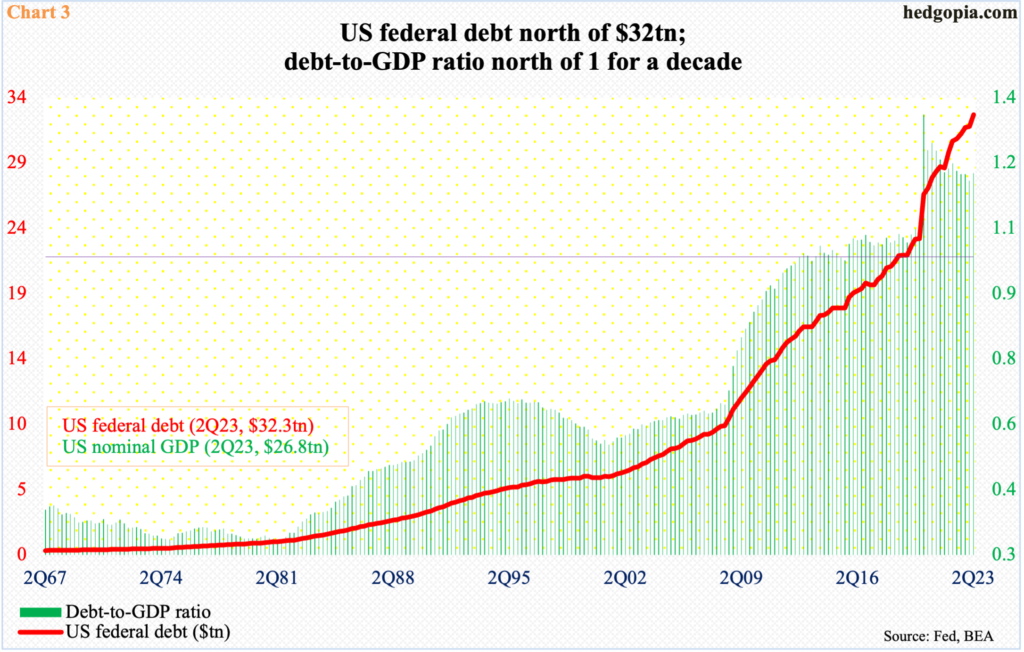
As of the June quarter, the federal government held $32.3 trillion in debt, which as of this writing has grown to $32.7 trillion – and rising. Nominal GDP was $26.8 trillion in the June quarter, resulting in a debt-to-GDP ratio of 1.21. The ratio has remained north of one for a whole decade now (Chart 3).

Ordinarily, this should have been unsustainable. But the US benefits from its reserve-currency status, not to mention the fact that it is the largest economy of the world. Although two of the three leading rating agencies have now cut US sovereign credit to AA+ – Fitch this week and S&P in 2011, with the Moody’s still maintaining its top grade Aaa – treasury securities are still considered risk-free and are sought after.
So, the persistently elevated debt-to-GDP ratio has not mattered. One reason for this is that when the 2007-2008 financial crisis was just getting underway, federal debt was $8.8 trillion, before going on to nearly quadruple. For most of the past 15 years, the fed funds rate was essentially zero-bound (Chart 1). This kept rates low and borrowers’ interest payments low.
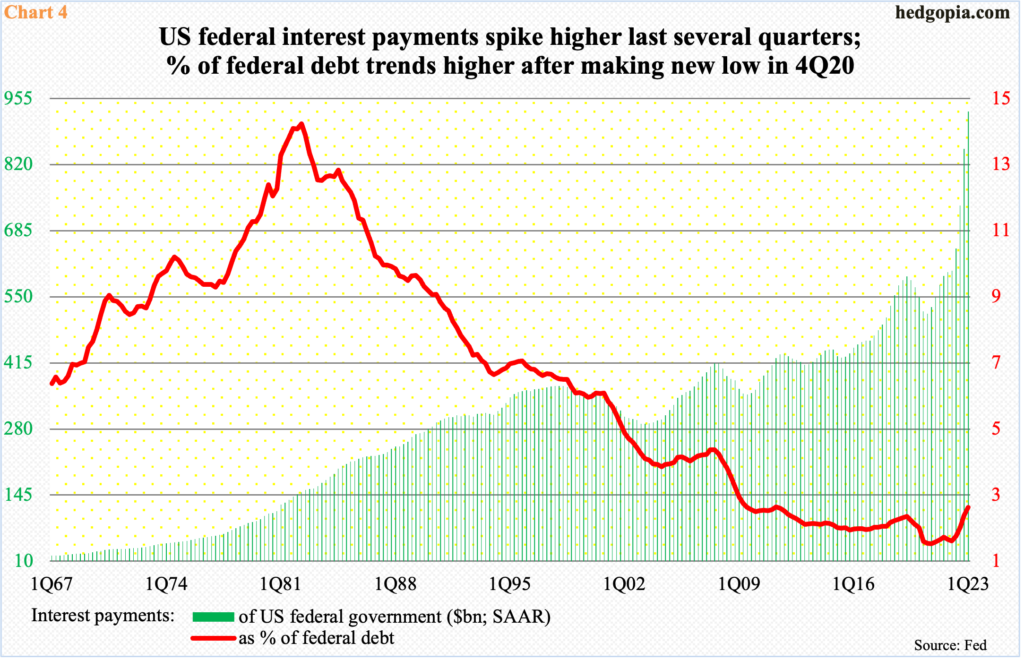
Rates have now risen to potentially matter. In the March quarter, annualized federal interest payments were $928.9 billion; six quarters before that, they were under $600 billion. In the March quarter, payments as a percent of debt, which can be treated as effective interest rate, comprised three percent, up from 1.9 percent in 4Q20 (Chart 4).
Rising rates in combination with rising budget deficit and rising issuance of debt can prove to be ill-fated. It is too soon to say if the chicken has come home to roost, but it is also the truth that the current fiscal trajectory is not headed in the direction and will only deteriorate, making the system more prone to shocks.
Thanks for reading!

