
U.S. corporations have had their share of blame as relates to capital expenditures, wages, etc., but have done a commendable job when it comes to taking advantage of the prevailing low interest-rate environment.
Corporate profits have come a long way. Back in 4Q08, profits adjusted for inventory and depreciation bottomed out at $1.02 trillion. By 2Q15, they had risen to $2.08 trillion (although peaked at $2.16 trillion in 3Q14).
The surge in profits has not been met with an aggressive push for capital expenditures. End-demand is tepid. Post-Great Recession, real GDP has only averaged 2.2-percent growth, versus an average 3.3 percent going back to 2Q47.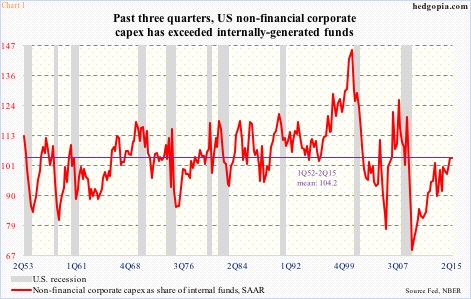
In this context, it may be unfair to blame corporate board rooms for not getting aggressive with capX plans. Why bother adding to the capital stock if it just ends up sitting idle? In 2Q, non-financial corporations spent $1.89 trillion in capex (at a seasonally adjusted rate) – an all-time high. Internally-generated funds were $1.63 trillion, which peaked at $1.74 trillion in 3Q14.
As Chart 1 shows, it is only recently that corporations have been spending in excess of what they have been generating internally. The red line in the chart acts very weak versus past recoveries. Once again, this action – or inaction – can be defended by saying that these companies are being rational given how tentative the current economic recovery has been.
However, can they be blamed for being a Scrooge and not wanting to give their employees a fair share? Possibly. The persistent sluggishness in wage growth in the face of record corporate profits is a head-scratcher for many economists. True, it is a seller’s market for U.S. workers currently, but we are also in the seventh year of the recovery.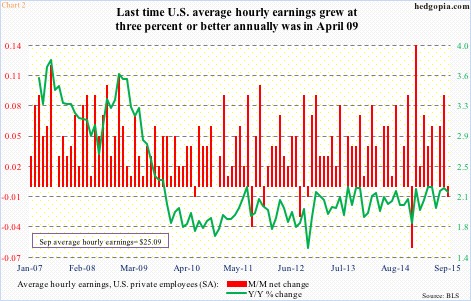
Yet the average hourly earnings of private-sector employees are stuck in the mud. At $25.09 in September, they grew 2.2 percent annually. Throughout this recovery, wages have only grown in the two percent range. The last time the green line in the chart increased with a three handle was in April 2009, just before the Great Recession ended (Chart 2).
Through employees’ eyes, it is hard to justify Chart 2 when they also see Chart 3. Since 2009, share buybacks have gone through the roof. Numbers vary depending on whose numbers we are looking at, but the trend is up. FactSet points out that share repurchases by S&P 500 companies were $134.4 billion in the July second quarter, and $555.5 billion on a trailing 12-month basis; spending on buybacks exceeded free cash flow for the first time since October 2009.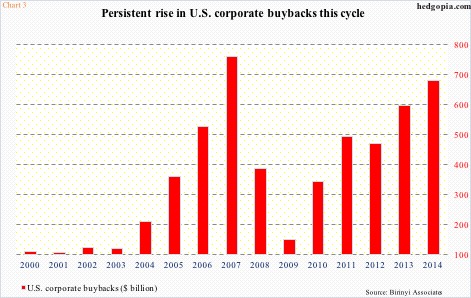
Besides deploying cash flow, corporations have also been issuing debt to fund share buybacks. Non-financial corporate debt has risen from $6 trillion in 4Q10 to $7.9 trillion in 2Q15.
Debt issuance exceeded $1 trillion for five straight years through 2014, and 2015 is on course for another record year. In the first three quarters this year, investment-grade credit issuance equaled $978.5 billion, and high-yield $224.4 billion (Chart 4). (This is non-convertible debt. Convertible makes up a very small share of the total issuance; in 2014, it comprised $37.5 billion.)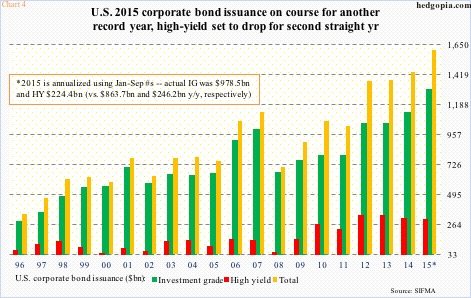
It is worth pointing out that at the current pace high-yield will have contracted for a second straight year, although from a very elevated level. Understandably so, considering what is going on in energy in particular. But investment-grade is on pace to notching another record.
Now here is the thing.
Yes, all this debt has not gone toward adding to the capital stock. In an ideal world, the corporate balance sheet would be in much better shape without all this leverage. But now that it is there, here is what corporations have been doing right.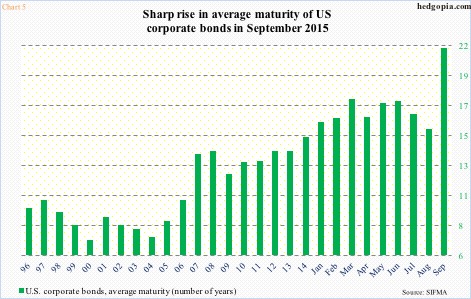
Look at Chart 5. Thanks to the Fed and its zero interest-rate policy, rates have continued to stay suppressed. For more than five years now, the 10-year Treasury yield has stayed south of four percent, and the two-year yield under one percent.
Corporations have taken advantage of this, by continuously extending debt maturity. As early as 2004, the average maturity of corporate bonds stood at 7.4 years, rising to 14.7 last year. Through August, March’s 17.5 years was the highest. Then came September, which shot up to 21.3 years (Chart 5). This is a positive, and kudos to corporate treasurers for achieving this, although it is a no-brainer.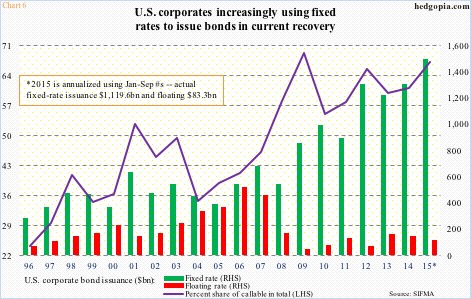
As well, they have increasingly locked in fixed rates. So far this year, fixed-rate issuance equaled 93 percent of the total – nearly $1.5 trillion, versus $111 billion in floating-rate (Chart 6).
Ironically, corporations have continued to rely on callable debt – north of 67 percent so far this year. The main reason a debt gets called is a decline in interest rates so it gets refinanced at lower rates. Rates are already zero-bound. Unless they expect negative rates in the future, this should at least suggest that corporations do not expect rates to meaningfully head higher anytime soon. Which, if true, also jibes with their rather nonchalant attitude toward capX.
Thanks for reading!
