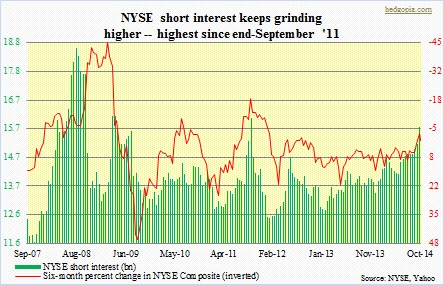
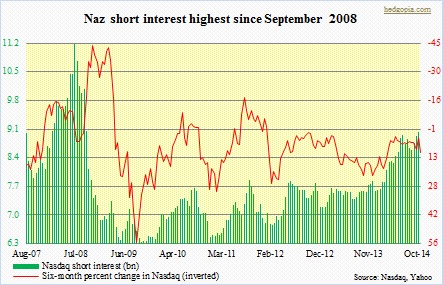
- Shorts continued to raise bets, with short interest at multi-year highs
- October 15th reversal followed by sharp advance probably caused short-covering
- With QE gone and broken trendline resistance on S&P 500 intact, shorts could get active again
Bulls probably took advantage of the opportunity accorded them to squeeze shorts. They must have. In the latest period (October 15th), short interest rose 1.1 percent on the Nasdaq but surged four percent on the NYSE. On the latter, short interest is now sitting at a three-year high, even as the former is at a six-year high. The latest increase in short interest should not come as a surprise in that between September 30th and October 15th intra-day highs and lows the S&P 500 Large Cap Index gave up 165 points. Short interest had been persistently building up into that drop. On September 30th, the S&P 500 lost its 50-day moving average, proceeding to lose the 200 by October 13th. This has to have emboldened shorts to add to positions, which is what is reflected in the latest short-interest data. 
October 15th was when stocks staged a reversal. The sharp bounce since has come on relatively light volume. There is not much institutional buying footprint. Be that as it may, as sellers got washed out, the subsequent advance did manage to take out important resistance. On the S&P 500 in particular, first it was the 200-day average, then 61.8-percent Fibonacci retracement, followed by the 50-day average. The Nasdaq as well as the Dow also retook both the 50- and 200-day average. The NYSE Composite is barely above 200 but below 50; ditto with the Russell 2000 Small Cap Index. Point is, as one after another resistance fell, shorts must have come under pressure to cover. One classic example was the Russell 2000 on Monday when it took out both its 50- and 200-day average; the index shot up nearly three percent in an otherwise o.k. up day. On IWM, short interest had risen from 142mn a month ago to 155mn. Across sectors, other notable period-over-period increase included XLF (from 128mn to 143mn), XLI (from 45mn to 56mn), XLY (from 21mn to 30mn), XLE (from 46mn to 54mn); SPY’s went from 255mn to 292mn. 
This leaves ample room for short-covering. Whether or not this gets reflected in the October 15-31 report will depend on what transpires during the final two trading sessions. By the time yesterday’s session was over, two things were different from when the session began: (1) the Fed is done with its QE, and (2) the previously discussed underside of the broken two-year trendline was unsuccessfully tested. Reason enough for shorts – at least the aggressive ones – to dip their toe in the shorting pond.

