
Off February 11th lows through recent highs, U.S. stocks rallied handsomely, ranging from nearly 23 percent on the Russell 2000 small cap index to nearly 17 percent on the S&P 500 large cap index. Probably enough to take care of at least a good portion of the bearish sentiment that prevailed at the lows.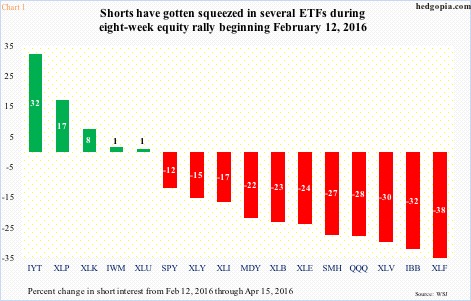
Shorts have paid a big price. Chart 1 plots the change in short interest on various ETFs between February 12th and April 15th this year. On some, it has gone up, but on a good majority, it has gone down. The resulting squeeze played a major role in sustaining the equity rally.
Non-commercials’ holdings in e-mini S&P 500 futures are the same way. In the week ended February 9th, they had 234,321 contracts in net shorts. (The index bottomed on February 11th.) Then the green bars in Chart 2 began to shrink. Once again, this was a big tailwind for stocks. By the latest reporting period (last Tuesday), net shorts were all gone. Now they are net long 1,460 contracts. Squeeze fuel is no more.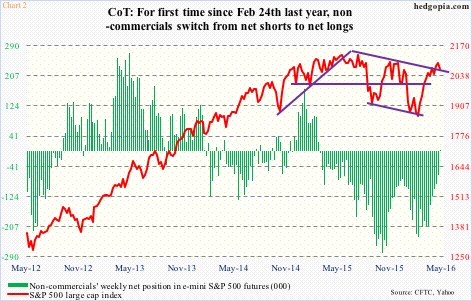
Both Charts 1 and 2 help us measure which way sentiment is blowing, and both involve actual money.
There are some other popular sentiment measures that are only survey-based, but in their own right do a good job of taking a pulse of prevailing investor sentiment.
The National Association of Active Investment Managers puts out a weekly survey of members’ average exposure to U.S. equities. Unlike survey-based Investors Intelligence (II) and American Association of Individual Investors (AAII), the NAIIM Exposure Index provides insight into the actual adjustments members make to client accounts. We are talking real money.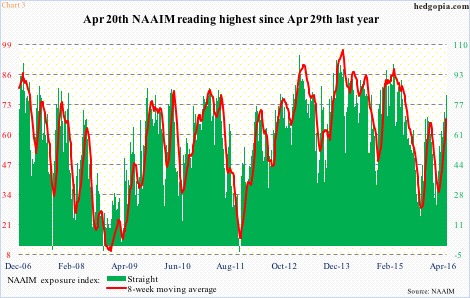
On February 3rd, the NAIIM index dropped to 22.4 before rising, along with stocks. By April 20th, it had shot up to 82.5, which was the highest since April 29th last year. April 27th (this year) was 74.2 (Chart 3). The eight-week moving average was 66.9, higher than 65.1 on December 23rd last year; back then, a week later, stocks began a two-week collapse. Too soon to say if we are seeing a repeat of that.
Both survey-based II and AAII, however, do show shrinking ranks of bears.
At 21.5 percent on April 7th, the percentage of AAII-polled individual investors who expect U.S. stocks to fall over the next six months was at its lowest level since December 3rd last year.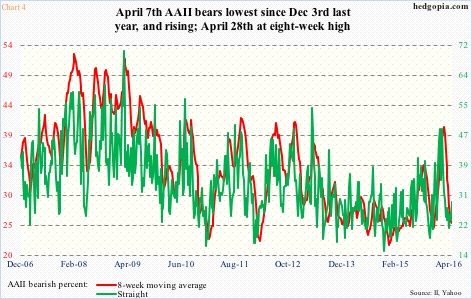
For the week ended April 28th, AAII bearish investors were 28.6 percent – the highest since 29.3 percent on March 3rd. On February 11th, they had surged to as high as 48.7 percent; soon, their ranks began to contract, and stocks rose. There is plenty of room for the green line in Chart 4 to rise before reaching extended levels – the kind reached in early February.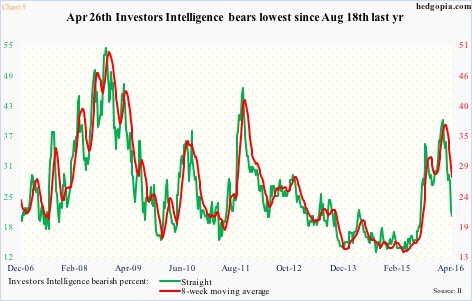
Over at Investors Intelligence, bears were 20.6 percent on April 27th. That was the lowest since 18.4 percent on August 18th last year (Chart 5); back then, soon followed a six-day waterfall dive. On February 9th, bears were as high as 39.2 percent, and that led the foundation for the equity rally that followed. The current reading is nowhere near that, and reeks of complacency.
A reliable way of shaking investors out of complacency is for stocks to go down.
Thanks for reading!
