
Any economist or investment professional who knows a thing or two about what is going on in the U.S. job market knows not to be misled by the rapid decline in the unemployment rate. From the cycle high 10 percent in October 2009, it has progressively dropped to 6.3 percent. On the surface, this represents massive improvement – and it is – but in the big scheme of things probably not so much. Between the stated periods, U.S. population grew from 308mn to 318mn (as of March) – for growth of 3.2 percent – the civilian labor force from 153.8mn to 155.4mn – growth of one percent – even as the civilian labor force participation rate dropped from 65 percent to 62.8 percent.
Clearly, if participation remained at least unchanged, the unemployment rate would be much higher. From the cycle low in February 2010, a total of 8.6mn jobs has been created to date, nevertheless the April payroll (non-farm) reading of 138.3mn was still over 100k short of the 138.4mn peak in January 2008. Not to beat a dead horse, but the jobs recovery has been snail-like.
This is reflected in another data point put out by the BLS. The Job Openings and Labor Turnover Survey (JOLTS) is a monthly series to help measure job vacancies, etc. It goes back to 2004, and includes information on ‘hires’, which JOLTS defines as all additions to the payroll during the month. Another category ‘quits’ measures voluntary separations by employees (except for retirements, which are reported as ‘other separations’).
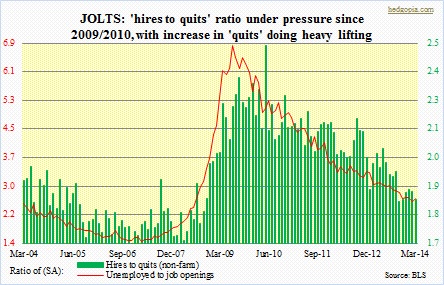 Employees naturally feel comfortable quitting when jobs are plentiful and they have no worries about finding one. In the accompanying chart, a ratio has been created between ‘hires’ and ‘quits’. A ratio can drop two ways – either the numerator gets smaller or the denominator gets larger, or a combination thereof. In this case, since the series began, ‘hires’ has dropped from 4.84mn to 4.63mn, while ‘quits’ has risen from 2.42mn to 2.48mn. However, since the 2009/2010 peak, bulk of the heavy lifting behind the drop (in the ratio) has been done by the increase in ‘quits.’ The other ratio, ‘unemployed to job openings’, too, portrays a slightly improving picture. Since the July 2009 peak, ‘unemployed’ (household survey) has dropped from 14.6mn to 9.8mn, even as ‘job openings’ has nearly doubled from 2.1mn to 4mn; the ratio is receiving help from both the numerator and denominator. A good thing!
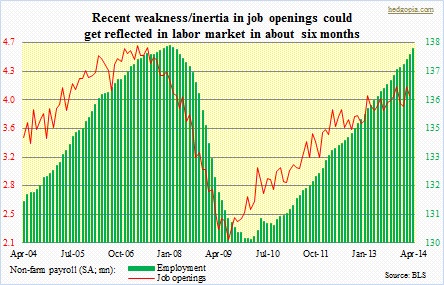 And then there is this chart. A word of caution: this series goes back less than a decade, hence does not cover enough business cycles. Nevertheless, based on what has transpired on two occasions – one up and one down – a trend can be spotted. ‘Job openings’ (JOLTS) has tended to lead overall employment by six months. Back in August 2007, the former peaked at 4.5mn, followed by a peak in employment at 138.4mn in January of the following year. Similarly, it bottomed at 2.1mn in July 2009; ‘employment’ followed suit at 129.7mn in February 2010. Most recently, ‘job openings’ peaked in November last year and has been more or less meandering since. Unless it manages to regain its upward trajectory, we are probably looking at weakness in employment in the months to come. Nothing is etched in stone, but this is definitely something to watch in the months ahead.
