
After four weekly drops in a row, major US stock indices gained last week. Encouragingly for equity bulls, some important patterns have formed technically. More gains are probable.
Before last week’s 1.4-percent jump, the S&P 500 suffered four consecutive down weeks. Even during this downtrend, equity bulls were showing up in the latter two weeks, buying between 3760s and 3780s.
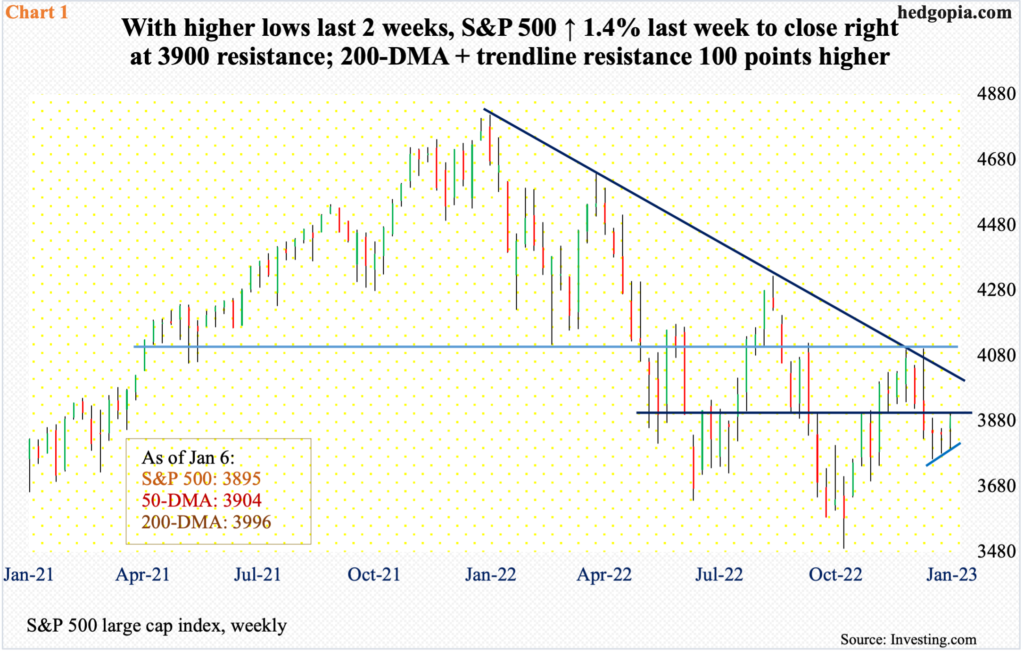
The buying pressure was evident in weekly candles – a bullish hammer last week, a dragonfly doji before that and a spinning top before that (Chart 1). There is also a pattern of lower highs.
Last week, the large cap index (3895) closed right at 3900 horizontal resistance. The index has traded either side of this since last May. The 50-day (3904) lies right there; as a matter of fact, the average was tagged last Friday. Odds favor this dual roadblock yields in the sessions ahead.
The 200-day lies at 3996, which coincides with a falling trend line from last January when the S&P 500 peaked at 4819. In the right circumstances, bulls even have a shot at 4100.
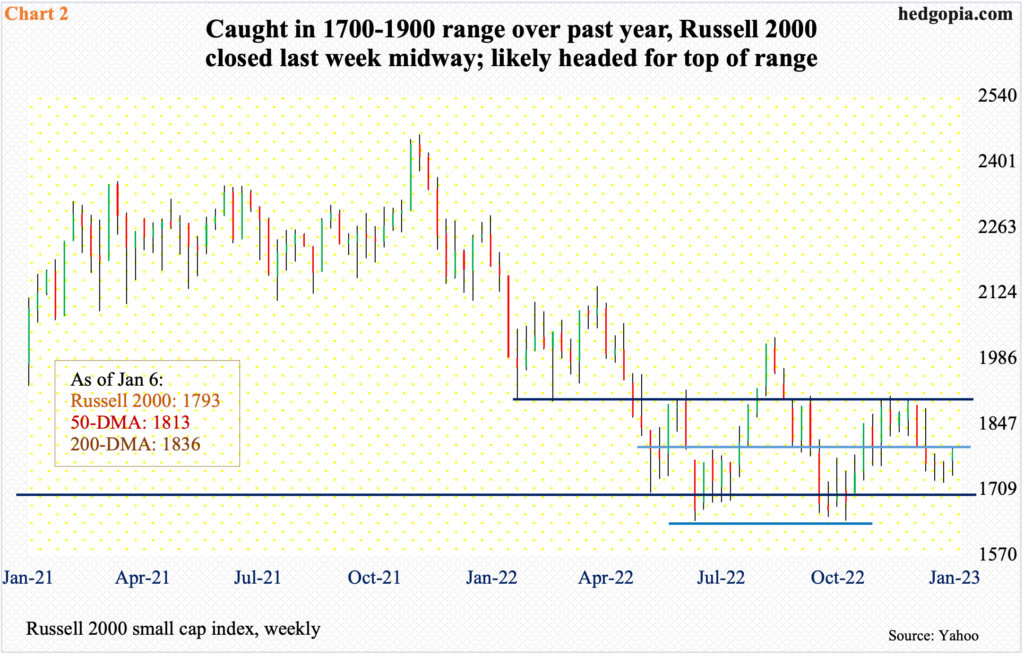
Incidentally, the Russell 2000 has traded the exact same way – give and take.
Similar to the S&P 500, the small cap index respectively formed a weekly hammer, a dragonfly doji, and a spinning top in the last three weeks.
Last week’s 1.8-percent rally put it midway through a 200-point range. For a year now, the Russell 2000 has gone back and forth between 1900 and 1700 (Chart 2). There were several rejections at 1900 last November, even as bids showed up well before the bottom of the range was truly tested the last several weeks.
Immediately ahead, the 50- and 200-day lie at 1813 and 1836, in that order. A takeout ahead opens the door toward the top of the range.
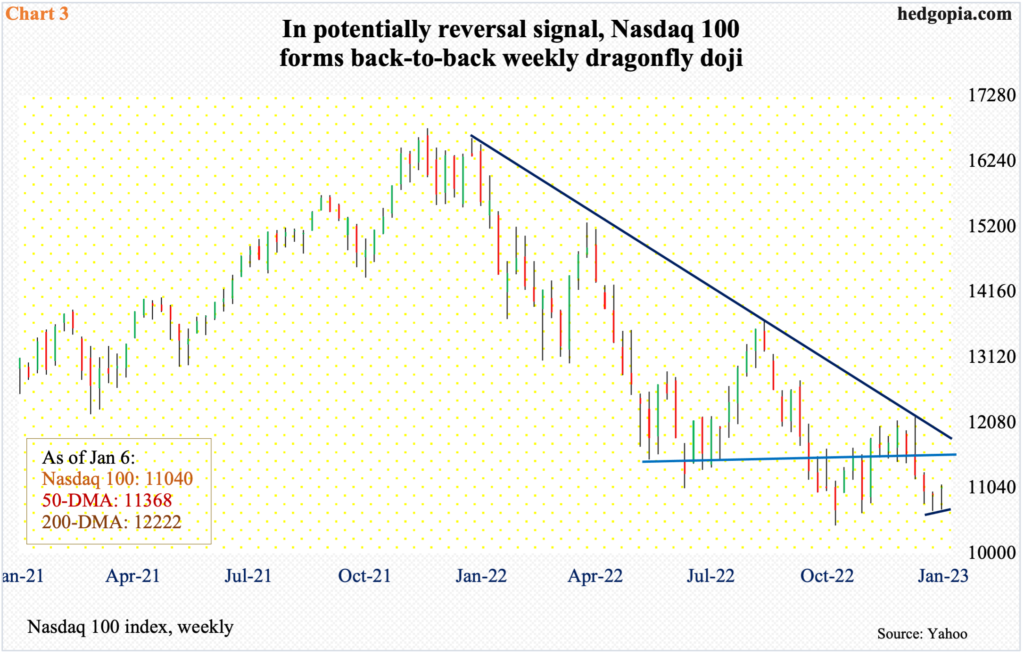
Of late, tech has taken the brunt of the selling. Even last week, the Nasdaq 100 only rallied 0.9 percent. Like its peers, it too suffered four negative weeks leading up to last week’s rally. Amidst this have formed two potentially important candles on the weekly. A dragonfly doji developed back-to-back (Chart 3).
Last Friday, the Nasdaq 100 dropped to 10696 intraday before closing the session up 2.8 percent to 11040. The week before, the tech-heavy index ticked 10671 to close out the week at 10940.
The bottom line is that tech is beginning to garner interest – duration and magnitude notwithstanding. Ahead, there is horizontal resistance at 11400, with the 50-day at 11368. This just about lines up with a falling trend line from December 2021; a month before that, the Nasdaq 100 peaked at 16765.
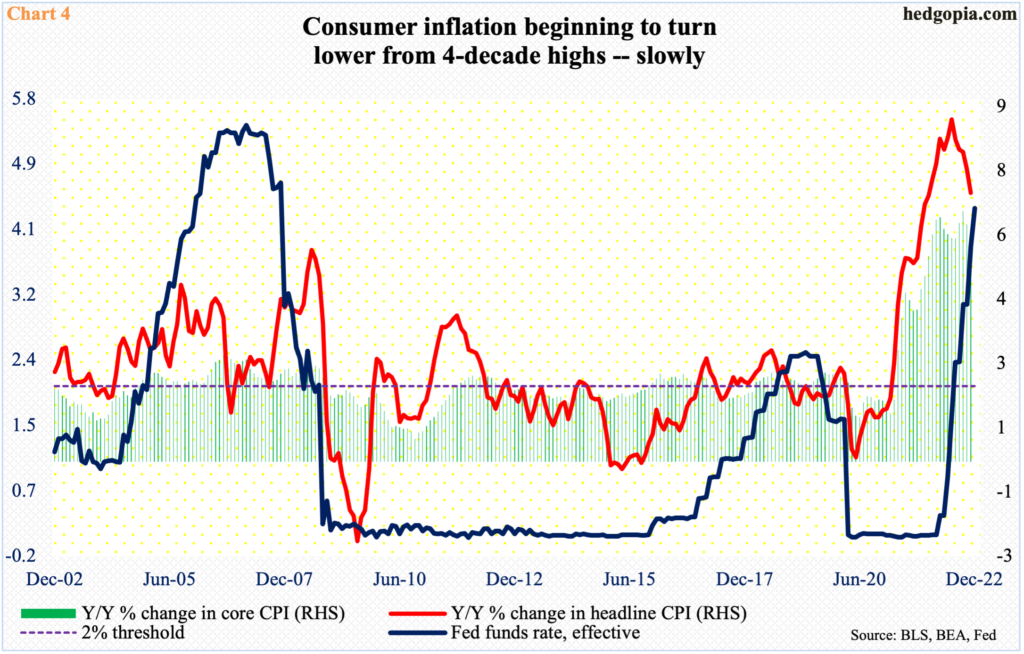
This Thursday, the Bureau of Labor Statistics will report December’s consumer price index. With the Federal Reserve squarely focused on inflation, this one is being watched closely and has the potential to move the markets.
Inflation has been trending down in recent months, but from a very elevated level (Chart 4). In the 12 months to November, headline and core CPI jumped 7.1 percent and six percent, which respectively peaked at 9.1 percent and 6.6 percent last June and September, which were four-decade highs.
The central bank has raised the fed funds rate from zero to 25 basis points last March to the current range of 425 basis points to 450 basis points. They have guided to a cycle peak of 5.1 percent this year.
The question is, how long before the Fed pivots and begins to lower the benchmark rates? As things stand, it says there will be no rate cuts this year. Markets, on the other hand, are betting on a peak south of five percent early this year and on easing to begin later this year. Amidst this push-and-pull, if inflation comes in softer than expected, odds heavily favor a rally in equities. It is possible even a higher CPI print will be embraced on the supposition that, either way, the Fed is getting close to the end of its rate-tightening campaign.
Thanks for reading!
