
An oversold reflex rally is due in major US indices. This week, major tech outfits report their March quarter. This could act as a catalyst. If post-earnings reaction instead acts as a headwind, the FOMC meets on May 3-4. The futures market has already priced in a very aggressive tightening cycle through July next year. A 50-basis-point hike in that meeting could very well be a ‘sell the rumor, buy the news’ phenomenon.
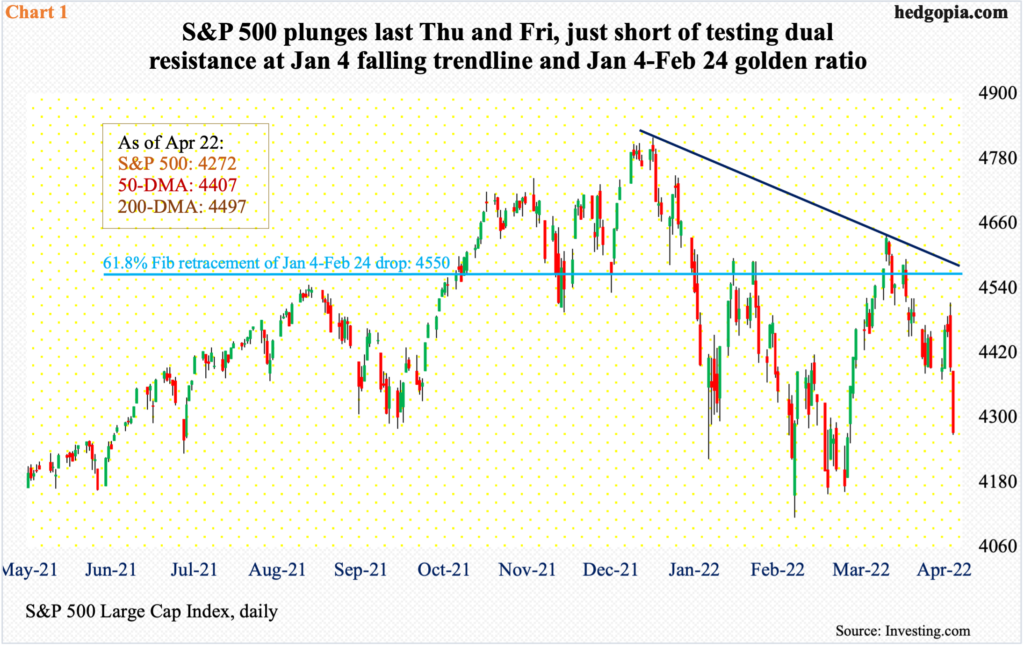
Until Thursday morning last week, equity bulls were sitting pretty. The S&P 500 was already up 1.5 percent in the first three sessions. The strength in overnight futures continued as the regular session opened; by the first 20 minutes, the large cap index was up 1.2 percent. Then it hit the wall. By the time Thursday closed, it ended down 1.5 percent; with an intraday high of 4513, The reversal came just above the 200-day moving average (4497). This was followed by Friday’s 2.8-percent plunge.
The excuse was Federal Reserve Chair Jerome Powell’s speech that morning in which he made it clear the central bank was committed to raising rates “expeditiously” to lower inflation, implying a 50-basis-point increase was imminent in the May 3-4 meeting. This was nothing that should have shocked the markets. In the futures market, a hike of that magnitude was already priced in. Shorts in all probability were looking to get active at the 200-day, and they got their chance.
As a matter of fact, a dual resistance just above the 200-day was not even tested in earnest. The S&P 500 peaked on January 4 at 4819 and bottomed on February 24 at 4115, for a drop of 14.6 percent. A 61.8-percent Fibonacci retracement of this decline lies at 4550. This also coincides with a falling trend line from the January high (Chart 1).
The index remains oversold on the daily, but it is equally possible the downward momentum of last Thursday and Friday continues. In the first half last month, the index (4272) began to rally from 4150s and went as low as 4115 before that.
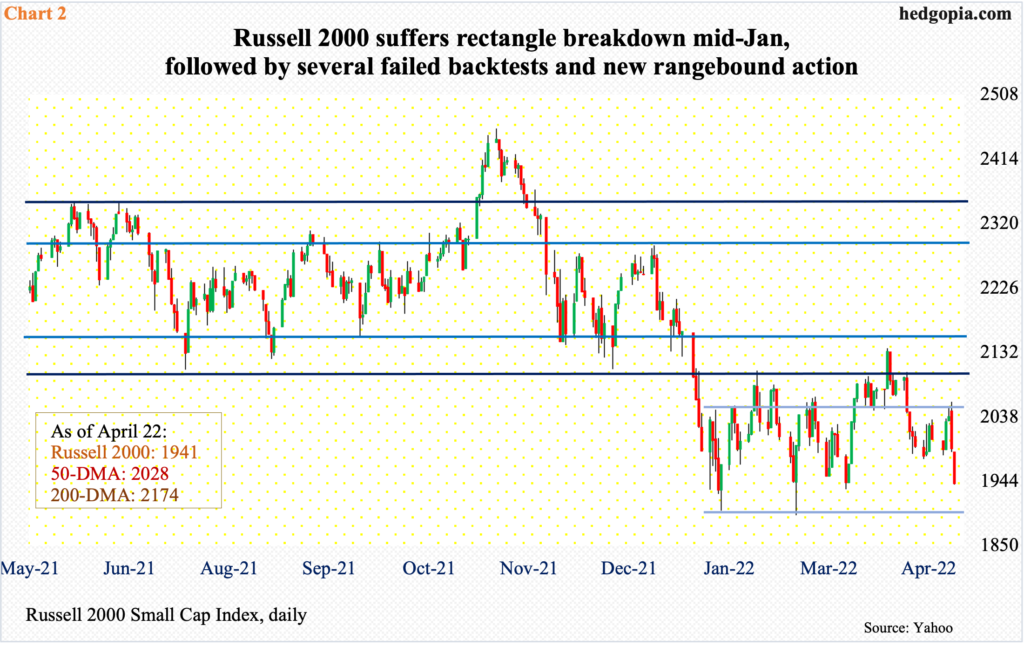
Small-caps fared worse than large-caps last week. The Russell 2000 declined 3.2 percent versus the S&P 500 down 2.8 percent.
The small cap index is now caught in a new range – between 2080s and 1900 (Chart 2). This has been going on since mid-January when the Russell 2000 dropped out of a months-long rectangle. The index (1941) has been rangebound between 2080s and 1900 the past three months. This preceded a rectangle breakdown mid-January.
From March last year through January, the Russell 2000 went back and forth between 2350s and 2080s, and between 2280s and 2150s within this box. On Nov 3, it broke out but was quickly followed by a failed retest on the 19th that month. Then came the breakdown and a double bottom at/near 1900 in late January and late February.
Hence, the past three months, the Russell 2000 has been bobbing up and down between 1900 and 2080s. In fact, 2050s is another level small-cap bulls have struggled to surpass, including last week. Whichever way it breaks, momentum likely follows. The lower bound is only 41 points away.
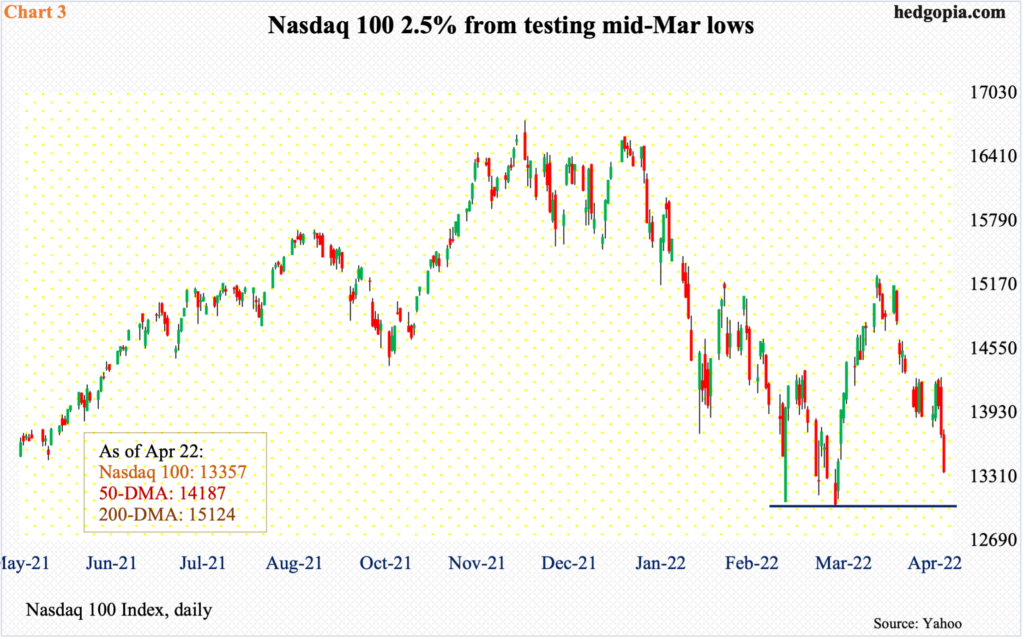
The Nasdaq 100 similarly is 2.5 percent from testing mid-March lows. The tech-heavy index on March 14 tagged 13020, which was a successful test of 13065 hit on February 24 (Chart 3). Between last November’s high of 16765 and last month’s low, it dropped 22.3 percent. A golden ratio of this decline lies at 15334. On March 29, the index rallied to 15265 before sellers showed up in droves.
The index has remained under the 50-day the last couple of weeks. Attempts to reclaim the average (14187) was vigorously denied last Thursday, when the Nasdaq 100 tagged 14277 but closed the session at 13720, down two percent. For the week, the index (13357) was down 3.9 percent.
Next week, several major tech outfits will report their March quarter – Microsoft (MSFT) and Google owner Alphabet (GOOG) on Tuesday, Facebook owner Meta Platforms (FB) on Wednesday, and Apple (AAPL) and Amazon (AMZN) on Thursday. Post-earnings reaction to these results will determine if the Nasdaq 100 – a market cap-weighted index – will proceed to test last month’s lows.
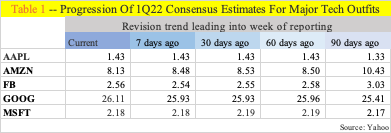
Leading up to this, MSFT, AMZN, GOOG and FB are below their 50- and 200-day, while AAPL is below the 50 but above the 200.
As relates to earnings, versus 90 days ago, March-quarter estimates are flat for MSFT and GOOG, slightly up for AAPL and down for AMZN and FB (Table 1). The bar is low – relatively.
Once again, the results from these five companies have the potential to make or mar next week’s price action. A reflex rally is due in these indices, and these results could very well act as a catalyst. Else, a rally will begin from a lower level, and a catalyst in this scenario will likely be the May 3-4 FOMC meeting.
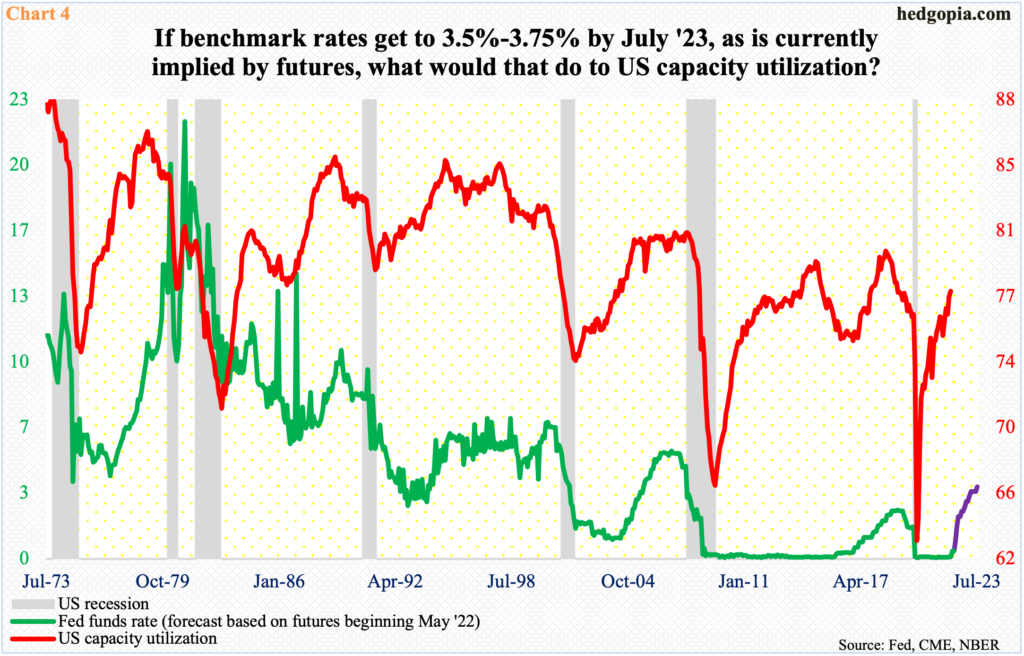
Ahead of this, the Fed’s hawkish meter has gone up several notches. The central bank plans to front-load, and markets are getting ready for this. If we are to go by the futures market, the fed funds rate will end 2022 at 275-300 basis points and July next year at 350-375 basis points.
As far as oversold equities are concerned, the May 3-4 meeting could very act as a ‘sell the rumor, buy the news’ phenomenon.
The bigger question is, if the benchmark rates indeed get to 3.5 percent to 3.75 percent in the next 15 months, what would that do to the economy? A significant slowdown is the best-case scenario and an outright recession the worst-case.
Chart 4 plots the US capacity utilization rate against the fed funds rate, with the latter in violet color implied by futures. In the past, a sustained rise in the fed funds rate has sooner or later caused a recession. As things stand, equities do not foresee this.
Thanks for reading!
