
Quite an anti-climax! Sunday’s Doha oil talks, that is. Even more so is how markets reacted on Monday.
The much-hyped and much-hoped-for agreement for an output freeze/cut failed to materialize. Crude oil had rallied strongly into these talks, so a give-back was only natural on news of no agreement.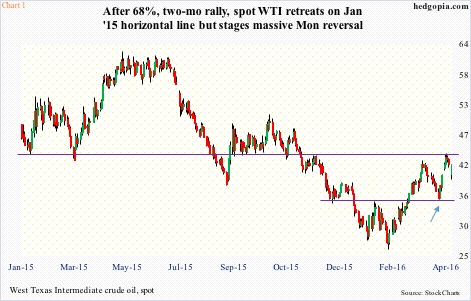
In fact, crude futures got smacked hard even as Asian and European sessions opened on Monday. Ditto with the U.S. session. In the regular session, spot West Texas Intermediate crude ($41.47) dropped as much as 6.6 percent to $39, but when it was all said and done closed down a mere 0.7 percent. What is Mr. Market’s message here?
Spot West Texas Intermediate crude rallied strongly after crucial support at $34.50-$35 held on April 5th (arrow in Chart 1), subsequently pushing past the 200-day moving average. It began to retreat on Wednesday after hitting the upper Bollinger Band as well as facing resistance at January 2015 horizontal line.
The early weakness on Monday had WTI losing the 200-day average but was recaptured by session end. Not much damage done, come to think of it. That said, conditions remain overbought. Should oil bulls be able to build on Monday’s reversal and force a breakout, repercussions will be many.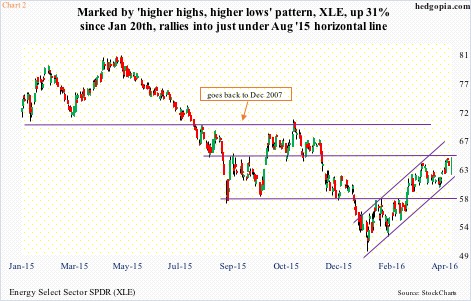
First and foremost is XLE, the SPDR energy ETF. It bottomed on January 20th, earlier than WTI, which bottomed on February 11th, like U.S. stocks in general. From that low through Monday’s intra-day high, XLE rallied 30.6 percent.
Monday’s was a huge reversal – from down 2.3 percent early in the session to up 1.6 percent by close. Buyers showed up near the lower end of a rising channel the ETF has been in the past three months (Chart 2). Right above is horizontal-line resistance from last August. Should a breakout occur, and the ETF heads toward the upper end of the channel, will shorts keep hanging on?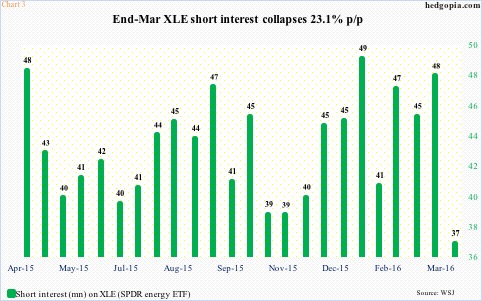
Short interest on XLE is already down big. In fact, during the March 15-31 period, it rose a mere 0.8 percent, yet short interest dropped north of 23 percent (Chart 3). Further strength on XLE will test the patience of these shorts.
For now, a breakout on WTI/XLE should throw another lifeline to U.S. shale oil. When news of a lack of a deal broke on Sunday, it looked like a final nail in the coffin of shale producers hoping for a deal. In the end, there was no deal, but crude prices are acting as if there was one.
If WTI breaks out, what would be Saudi Arabia’s reaction? It has been its goal to hurt shale all along. Firmer crude prices raise risks that a lot of shale oil that was at risk of being cut would be profitable again.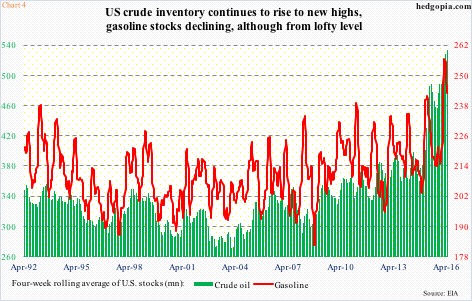
Chart 4 plots a four-week rolling average of stocks of U.S. crude and gasoline.
For the week ended April 8th, U.S. crude inventory rose by 6.6 million barrels to 536.5 million barrels – the highest since the all-time high 545 million barrels in 1929. In the past 14 weeks, stocks have gone up by 54.2 million barrels. The green line in Chart 4 is at an all-time high.
In the said week, gasoline stocks dropped 4.2 million barrels to 239.8 million barrels. Stocks have fallen by 18.9 million barrels in the past eight weeks. As a result, the red line in Chart 4 is coming under pressure but from a very lofty level.
Most analysts expect supply and demand balancing out later this year. In the latest week, U.S. crude production fell by 31,000 b/d to 8.98 mb/d. This was the first time production fell below nine mb/d since October 2014. Production is now down more than 600,000 barrels per day from the June 2015 peak of 9.61 mb/d.
All good, but what if Saudi Arabia, seeing crude prices firm up, tries to boost its production further – to, let us say, 11 mb/d?
Production is just not going down in the U.S. It is going down elsewhere, too. In due course, this should work itself out in favor of crude prices, with the risk that the higher the price the less incentive to cut production.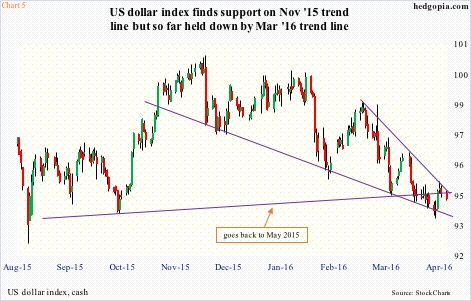
Then we have the dollar factor. On Monday, the US dollar index fell 0.24 percent to 94.46, helping crude prices. The index has been under pressure since early December, with some signs of stability, but it currently remains held down by a six-week declining trend line (Chart 5).
On a weekly chart, the dollar index looks as if it is itching to move higher. That said, non-commercials are yet to start building net longs in US dollar futures. As of last Tuesday, they cut holdings to a 10-month low (not shown here). This is a group worth watching.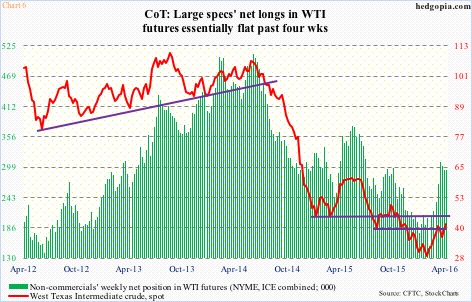
Speaking of which non-commercials’ net longs in WTI futures have more or less been going sideways/slightly down in the past four weeks (Chart 6). If Monday’s intra-day reversal in WTI has staying power, then it should be reflected in these traders’ holdings. Holdings as of today will be reported this Friday. Worth watching!
Thanks for reading!
