
The 3Q earnings reporting season just began. Revision trend has been down. Given the tightening monetary policy and the deteriorating outlook for next year, it is possible managements begin to lower guidance for next year, bringing into question the sell-side’s elevated optimism for 2023.
The 3Q22 earnings season began last week, with financials customarily getting the ball rolling. In general, banks with consumer focus did relatively well, while those with decent exposure to investment banking fared poorly.
It is too soon to conclude the consumer trend will persist throughout the reporting season. But the sell-side had been progressively lowering numbers going into last week.
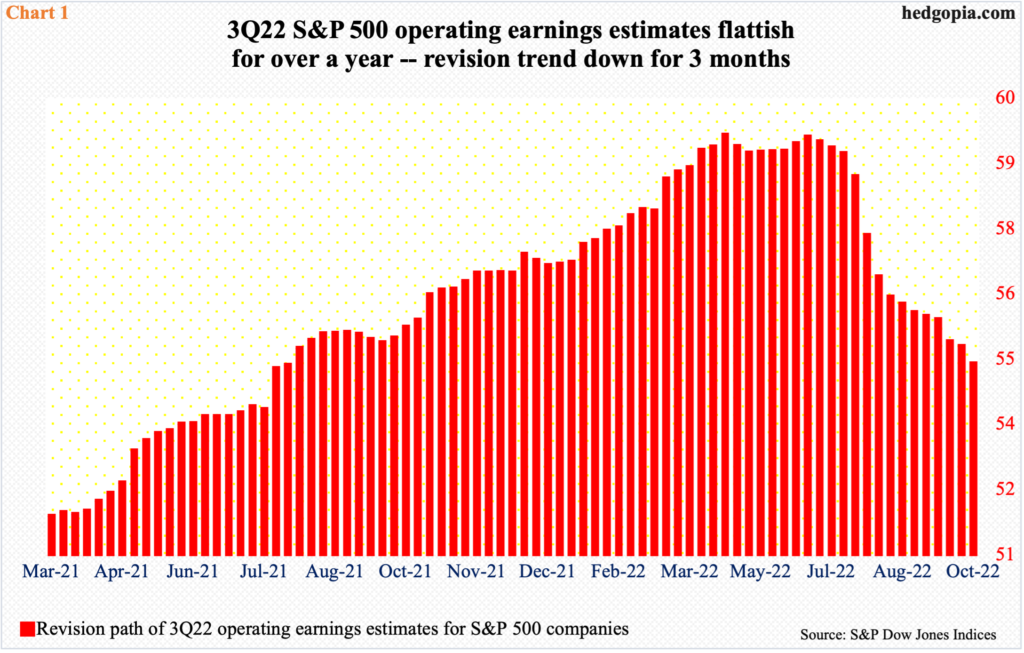
When 3Q began, these analysts were expecting S&P 500 companies to earn $55.82 in operations. As of October 5, the consensus was $54.80 (these estimates obviously do not include last Friday’s results from the likes of JP Morgan, Citibank, Wells Fargo, and Morgan Stanley.)
As a matter of fact, 3Q estimates peaked a while ago – at $59.36 as of April 27 this year – and began to unravel three months ago (Chart 1).
The downward revision trend is not just limited to 3Q, but the entire year as well as next year.
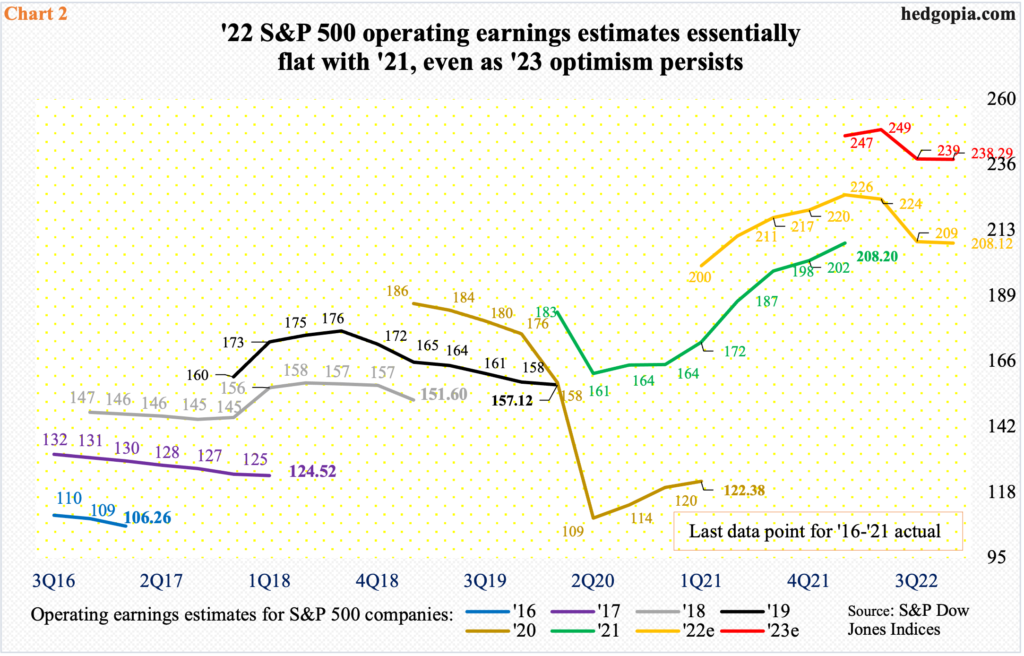
Estimates for both 2022 and 2023 peaked late April as well – respectively at $227.51 and $250.12; at the time, earnings were expected to grow 9.9 percent next year. As of the 5th (this month), these estimates stood at $208.12 and $238.29, in that order, for growth next year of 14.5 percent, meaning 2022 has borne the brunt of the downward revision trend so far, not 2023. Optimism around next year is very high, even though 2022 is essentially flat with 2021 (Chart 2).
Given the interest-rate trajectory in the face of elevated inflation, the hawkish Fed and growing worries about next year’s outlook, it is possible companies will begin to lower next year’s guidance as they report 3Q.
Already, the gap between reported (GAAP) and operating (non-GAAP) has widened extensively.
Over the years, the gap between the two has increased noticeably. Both measures are important in their own right. It is very possible non-GAAP tends to overstate earnings, while GAAP does the opposite. On balance, the lesser the discrepancy between the two, the higher the quality of earnings.
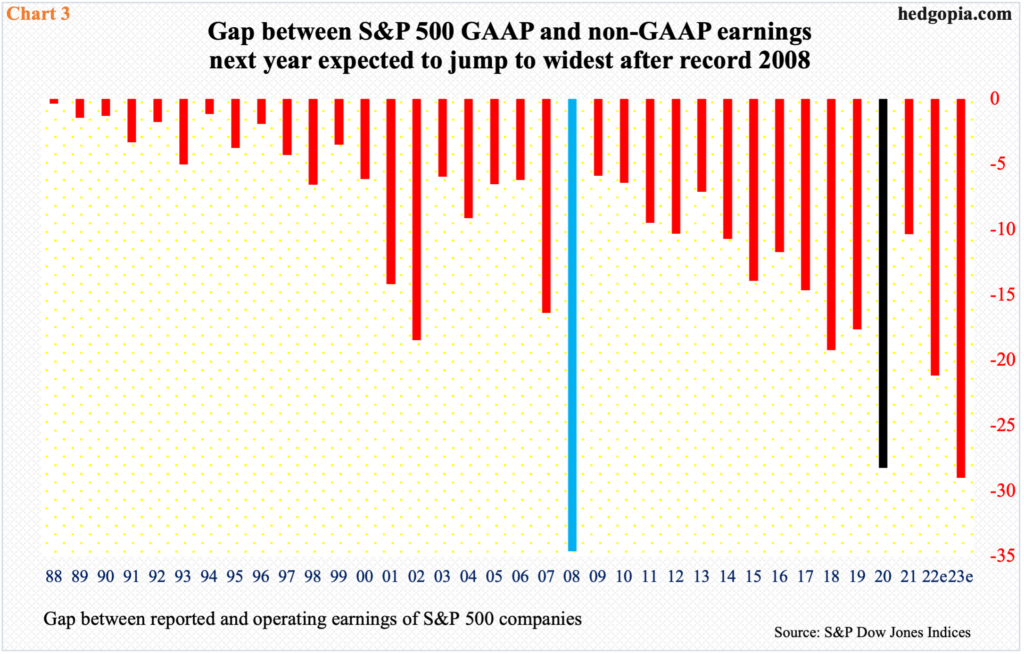
Currently, the sell-side expects $208.12 in non-GAAP and $186.95 in GAAP this year and $238.29 and $209.29 respectively next year, meaning this year’s gap of $21.17 widens to $29 next year.
As things stand, next year’s gap will be the widest since 2008 when non-GAAP exceeded GAAP by $34.63 (blue histogram in Chart 3). In 2020, the gap was $28.24 (black histogram). Both were recession years. Traditionally, GAAP earnings collapse during recessions as companies take asset write-downs, etc. Operating earnings tumbled 40 percent in 2008 and 22.1 percent in 2020. History thus does not bode well for 2023.
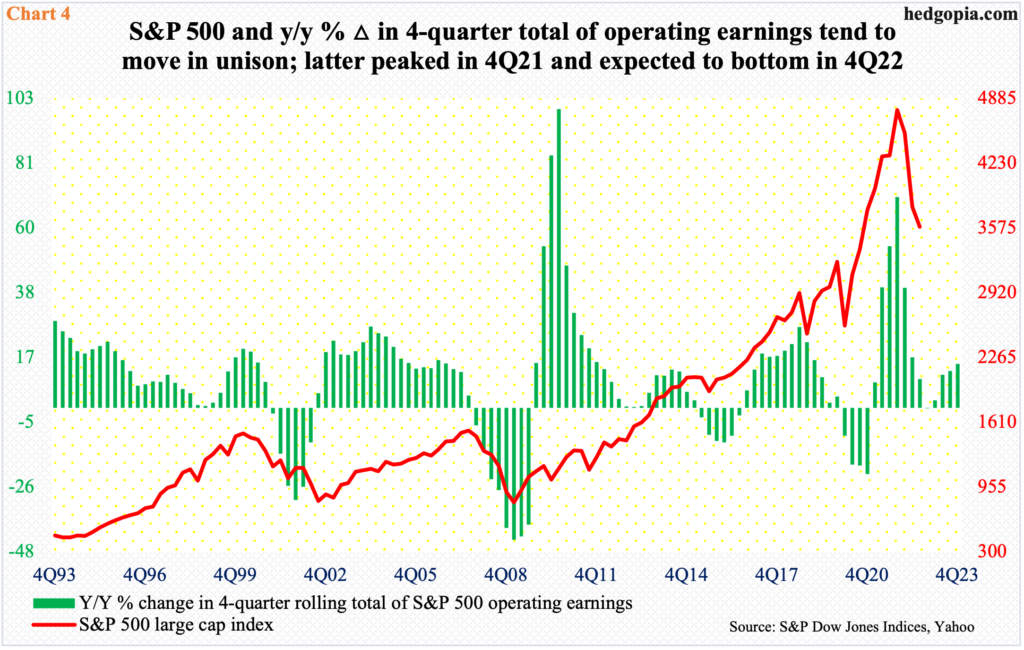
Chart 4 plots the S&P 500 against the year-over-year percent change in constituent companies’ operating earnings. The green histograms peaked in 4Q21 at 70.1 percent, with the S&P 500 peaking in the following January.
These histograms are set to bottom in the current quarter. From a minus 0.04 percent in the current quarter, earnings are expected to progressively grow, to 14.5 percent by 4Q next year. Traditionally, the S&P 500 tends to bottom around the pivot – give and take.
The problem is that we cannot take next year’s consensus at face value. All indications are that 2023 estimates are too high. So, depending on how things shake out, these histograms could look a whole lot different when it is all said and done.
Thanks for reading!
