
In U.S. equities, several sentiment measures are flashing red. The difficulty in using these as a signal is that they have been doing so for a while, even as U.S. stocks continue to rally to new and newer highs.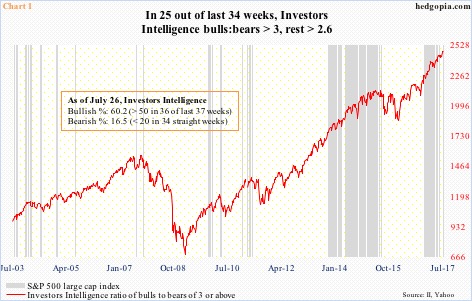
Since the presidential election in November last year, the S&P 500 large cap index is up nearly 16 percent.
Concurrently, since the week ended November 15 last year, Investors Intelligence bulls have persistently stayed above 50 percent, except for one week, when bulls dropped to 49.5 percent in late March this year. That is 36 weeks of north of 50 out of 37.
This week, bulls rose 2.4 points week-over-week to 60.2 – a 21-week high. Bears dropped two-tenths of a point to 16.5 – a two-year low, matching the low of early March this year.
Chart 1 plots a ratio between bulls and bears of three or above. This week, the ratio stood at 3.65.
Readings in excess of three are not common. Grey bars are few and far between on the left side of the chart. This began to change in October 2013, and most recently in December last year. Out of the afore-mentioned 37 weeks, 25 are north of three.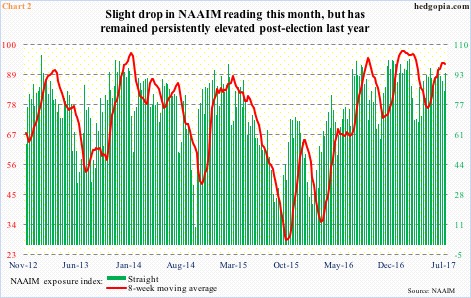
If we choose to dismiss the Investors Intelligence survey saying it is just a survey and that people say one thing and do the other, several other metrics are sending a similar message.
The NAAIM (National Association of Active Investment Managers) exposure index represents the average exposure to U.S. equity markets reported by its members. The index reflects the actual adjustments managers have made to client accounts over the past two weeks.
This week, the reading was 94.3 percent. Its recent high was 97.3 percent four weeks ago (Chart 2).
Importantly, it is rare for the exposure index to print 100-plus. In its 11-year-old history, it has risen above 100 a total of 10 times. Five of these occurred post-election.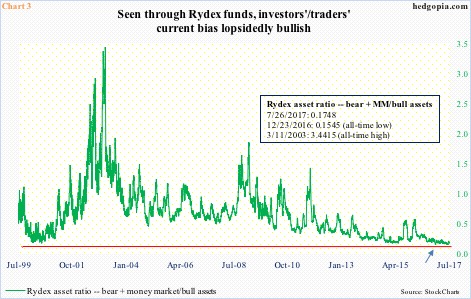
Chart 3 is another example of bullish money flows at their extreme.
The Rydex asset ratio divides Rydex bull assets into bear plus money-market assets. On Wednesday, it was less than 18 percent. The lower the ratio, the larger the share of bull funds. (Guggenheim Partners acquired Rydex funds in 2011.)
On December 23 last year, the share of bear funds plus money-market assets represented a mere 15.5 percent of bull assets (arrow in Chart 3). That was the lowest ever. (Data dates back to April 1998.) On the 7th this month, this dipped again to 15.7 percent before rising a tad.
If this gives an impression of an overcrowded long, it is. The problem is, this also has been the right trade to pursue, particularly post-election. Risk lies in when – not if – mean reversion occurs, and it is growing. The scale is too lopsided (bullish currently) to ensure a smooth exit.
Thanks for reading! Please share.
