
Last week, the Russell 2000 small cap index dropped 2.5 percent. The decline was much bigger versus what other major U.S. peers were handed out, with the S&P 500 large cap index down 0.7 percent, Nasdaq composite down 1.3 percent and NYSE composite down 0.9 percent. The Dow Industrials, in fact, was up 0.1 percent.
Simplistically, one of the ways to measure risk-on attitude among investors/traders is how small-caps are faring. Solely on this basis, the mood has shifted to risk-off.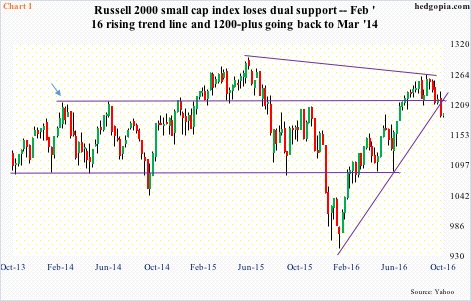
Back in March 2014, the Russell 2000 (1191.39) rallied to 1212.82 before receding (arrow in Chart 1). Since then, the 1200-plus level has proven to be an important price point. The index briefly broke out of it in February last year, rising to an all-time high 1296 in June that year. In the subsequent sell-off, that support was taken out in August last year, recaptured again in July this year, and lost again last week.
Last week’s sell-off also led the Russell 2000 to lose another crucial support – that of a trend line drawn from February this year. From that low to the September high, the index rallied 34 percent. No chump change. There is a lot of paper profit waiting to be locked in. The loss of dual support could prove important.
Thus far, the risk-off attitude is most evident in small-caps. Other indices are not completely immune, but are yet to experience the extent of damage suffered by the Russell 2000.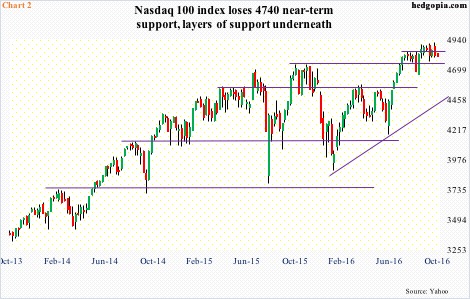
The Nasdaq 100 index (4801.27) scored a new all-time high of 4911.76 on Tuesday last week before coming under slight pressure. Incidentally, this was not accompanied by a new high on the Nasdaq composite.
Within tech, large-caps are leading. Apple (AAPL), Alphabet (GOOGL), Microsoft (MSFT), Amazon (AMZN) and Facebook (FB) comprise the five largest companies today, with GOOGL, MSFT and FB rising to new highs on Tuesday last week. They are doing all the heavy-lifting and are extended.
FB reports 3Q16 earnings tomorrow. Post-earnings, stocks of the other four reacted poorly.
On Friday last week, near-term support at 4840 on the Nasdaq 100 – as well as the 50-day moving average, which is now flat – was lost. Next support lies at 4740 – near the highs of November and December last year. Importantly, the February trend line is still intact, which will be tested around 4450. Before that, there is another horizontal support at 4560 going back to April last year (Chart 2).
The Nasdaq 100 is yet to suffer major damage. That said, it just suffered a weekly bearish MACD crossover.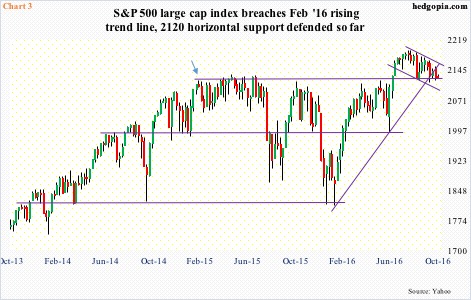
Over on the S&P 500 (2126.15), it is a mixed bag. The February trend line has been breached, with a failed backtest last week (Chart 3). On Monday last week, the now declining 50-day moving average repelled a rally attempt. Nonetheless, bulls on Friday defended support at 2120. Since early September, this support has been tested several times – so far successfully. This has been an important price point.
Back in February last year, the index hit 2120 and then came under slight pressure (arrow in Chart 3). Since then, the S&P 500 tried to break out several times – unsuccessfully – until early July this year. Once it broke out, the index rallied to 2193.81 on August 15. Since then, rally attempts have been repelled by a trend line drawn from that peak. But 2120 has held. Hence its significance.
The question is, will this in due course be a case of ‘Russell 2000 sneezes, and the S&P 500 catches a cold’? The answer probably lies in whether or not 2120 – or 2114 (October 13th low) – holds.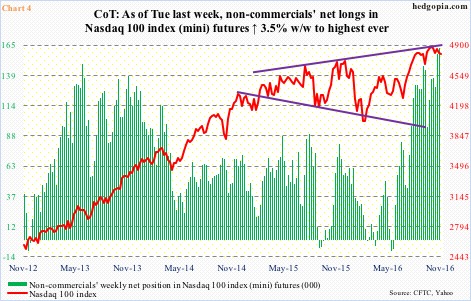
Or in how non-commercials in Nasdaq 100 index (mini) futures behave. As of Tuesday last week, they were holding 162,662 contracts in net longs – the highest ever. As early as the week ended September 13, they were net long 96,166 contracts. The index has rallied 1.8 percent since, but, as noted above, with some weakness of late.
The risk going forward is if and when these traders grow impatient and start cutting back. Last week, QQQ, the PowerShares Nasdaq 100 ETF, attracted $1.7 billion, (courtesy of ETF.com), yet the Nasdaq 100 fell one percent. If these longs get impatient, and flows do not cooperate, that can ultimately impact non-commercials’ holdings, which then will be adversely reflected in the Nasdaq 100 (cash). Worth watching.
Thanks for reading!
