
The S&P 500 on Monday broke out of an eight-week congestion, and can rally further if technicals had their way. Buybacks and margin debt are front and center. In the past three years in particular, their tailwinds have been bigger, but so have headwinds.
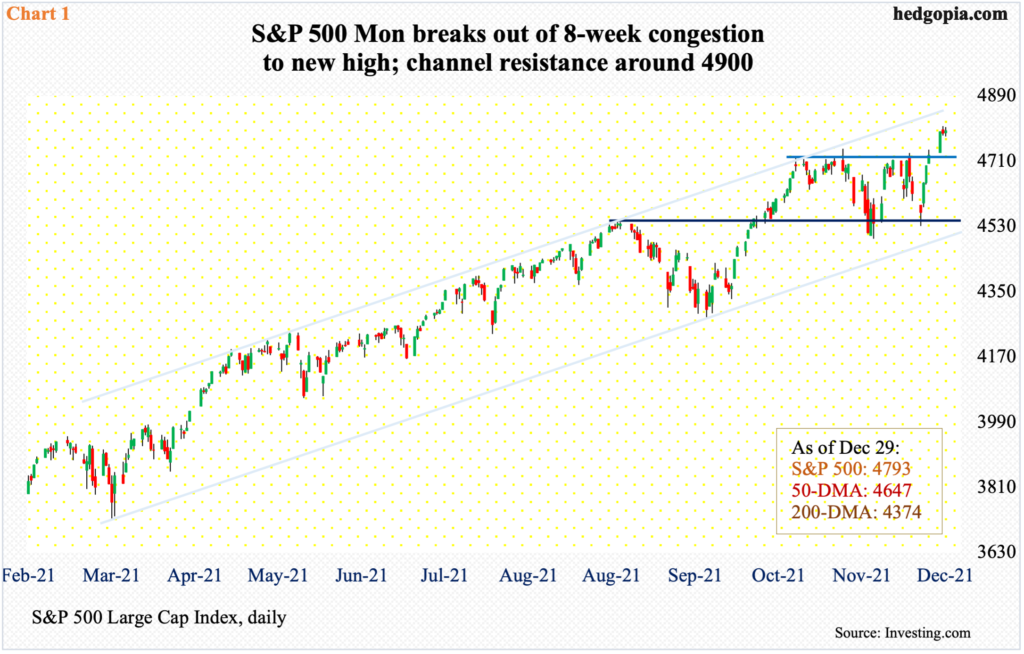
On the 22nd last month, the S&P 500 retreated after posting a new intraday high of 4744. Before and after that, it struggled north of 4700 several times. Come Monday, all that ended as the large cap index jumped 1.4 percent to break out of the eight-week consolidation. By Tuesday, 4807 was tagged intraday, closing at 4793 on Wednesday.
The latest rally unfolded after bulls defended 4540s seven sessions ago (Chart 1). Post-range breakout, using a measured-move approach, technically-oriented bulls are probably eyeing 4900 in due course. That is about where lies the upper bound of a months-long ascending channel.
Regardless how things shake out in the near term, bulls thus far have buybacks and margin debt going for them.
In 3Q21, S&P 500 companies spent $234.6 billion in buying back their own shares. This was a new quarterly high. In 2Q20, post-pandemic, buybacks had dropped to merely $88.7 billion. Concurrently, FINRA margin debt in November dropped $17.3 billion from October’s record $935.9 billion. This is more than double the post-pandemic low of $479.3 billion from March last year.
Both these metrics highlight the prevailing risk-on attitude – margin debt among equity longs and buybacks among corporate boards. So, a combination of the two can help shed light on the intensity of investor mood. As things stand, it is quite intense.
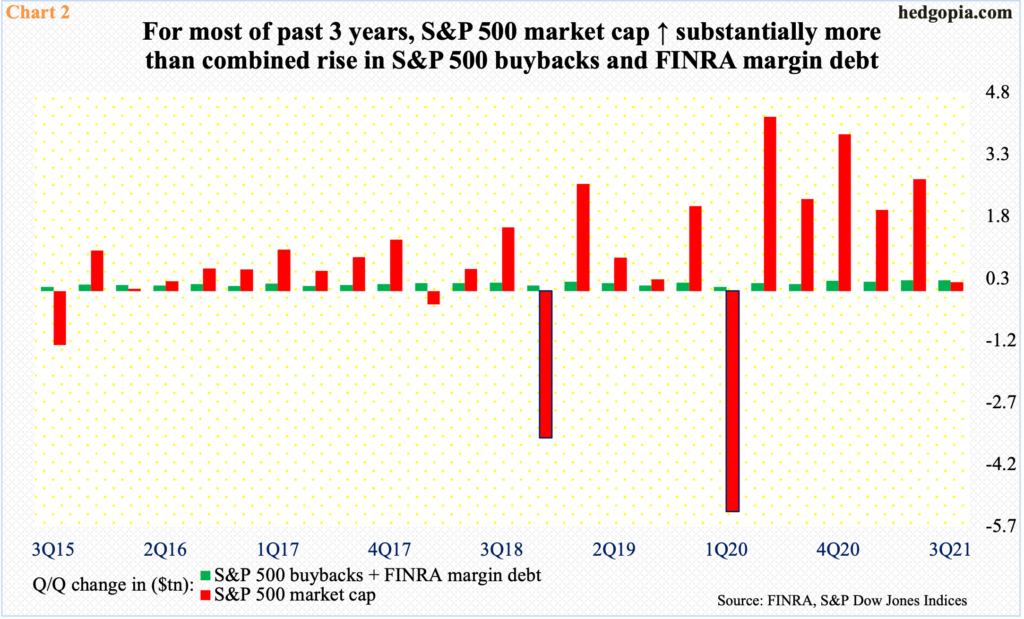
Chart 2 compares the quarter-over-quarter change in the S&P 500 market cap with the combined change in S&P 500 buybacks and FINRA margin debt. Up until three years ago, a rise in buybacks and margin debt helped the S&P 500 but it was, for lack of a better word, orderly. Then, the multiplier meaningfully shifted up.
In the past three years, the change in the market cap has been substantially more than the change in buybacks and margin debt. In 2Q21, for instance, the red histogram grew by $2.7 trillion and the green by $258 billion; 3Q21 was an exception in that they grew by $214 billion and $256 billion respectively.
This is obviously good news for longs, as they are getting a bigger bang for the margin debt-buybacks buck. There is this, though. Twice in the past three years, the S&P 500 had two down quarters – one in 4Q18 and the other in 1Q20 (red bars with blue borders). The market cap in those two quarters shrank by $3.6 trillion and $5.3 trillion, in that order. In contrast, S&P 500 buybacks and margin debt dropped to $129 billion in 4Q18 from $205 billion in 3Q18 and to $99 billion in 1Q20 from $205 billion in 4Q19.
The message is that it cuts both ways. A rise in buybacks and margin debt has tended to amount to bigger tailwinds for the S&P 500 but so has a drop, as headwinds have been equally sharp.
Thanks for reading!
