
The S&P 500 last week joined its peers to break out to new highs. More gains are likely in the near term. Mid-to long-term prospects are dependent on if the recent improvement seen in margin debt and equity flows persists.
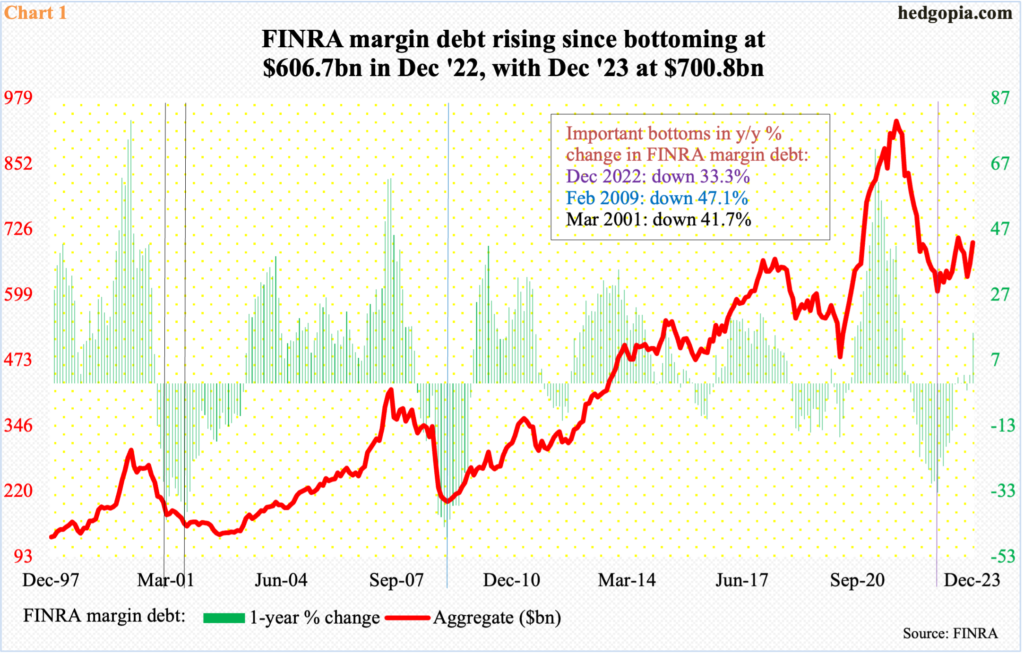
FINRA margin debt grew $39.9 billion month-over-month in December to $700.8 billion. It bottomed a year before that at $606.7 billion. US stocks bottomed last October; margin debt since has gone up by $65.5 billion.
That said, with the major equity indices having rallied to new highs in recent weeks, margin debt remains substantially below the October 2021 all-time high of $935.9 billion. Since that high through December 2022, margin debt tumbled $329.2 billion.
From a year ago, the December 2022 low was down 33.3 percent (indigo vertical line in Chart 1). This has the potential to be an important bottom. Going back to the late 1990s, there have been two other instances in which margin debt declined in the 30 percent to 40 percent.
In February 2009, margin debt fell 47.1 percent y/y (blue vertical line). In March 2001, it dropped 41.7 percent, which was just about matched in September that year with a drop of 41.6 percent (black vertical lines). The S&P 500 bottomed in March 2009 at 667 and in September 2001 at 945, with the latter retested/breached in October 2002 with a low of 769.
This time around, the large cap index bottomed last October and has since rallied just under 18 percent. If past is prelude, margin debt, which grew 15.5 percent y/y last month, has room to continue higher. Equity bulls hope history repeats itself. Margin debt has cooperated the last couple of months, and the bulls will need the streak to continue.
Flows, on the other hand, are active tentative.
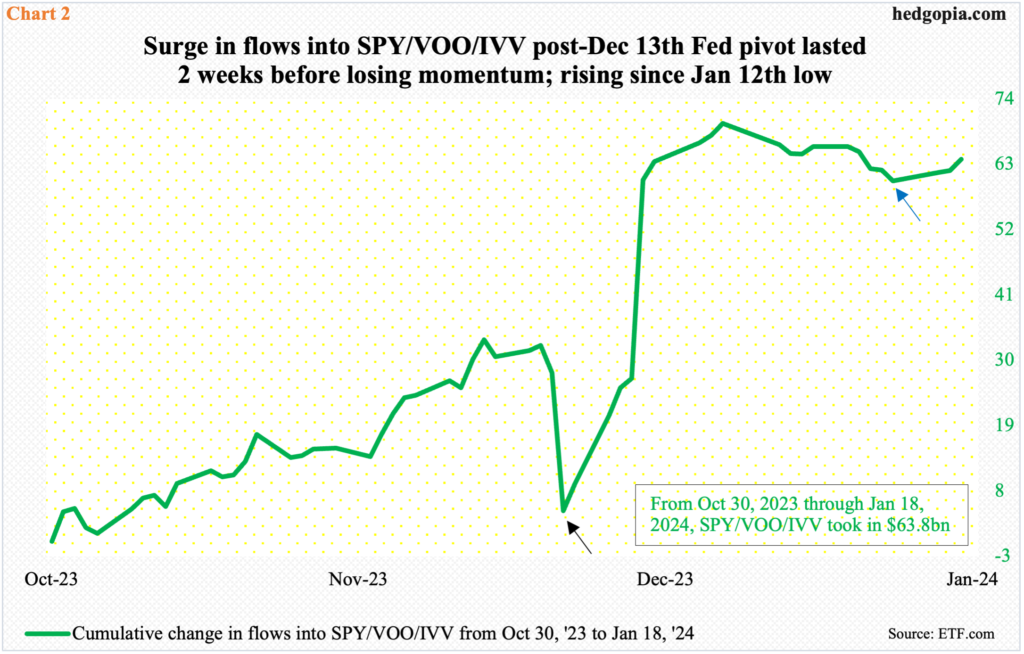
Chart 5 presents combined flows into SPY (SPDR S&P 500 ETF), VOO (Vanguard S&P 500 ETF) and IVV (iShares Core S&P 500 ETF) from October 30th last year. The S&P 500 bottomed on the previous Friday the 27th. Through December 14th – a day after the two-day FOMC meeting during which the Federal Reserve made a dovish pivot – the three ETFs had attracted $4.6 billion (black arrow in the chart). Then, they began to pile up. By the 28th, $69.9 billion came in, before momentum began to decelerate as the new year began.
By January 12th, flows troughed at $60.2 billion (blue arrow), with last Thursday at $63.8 billion. As things stand, equity bulls are betting that the uptrend continues.
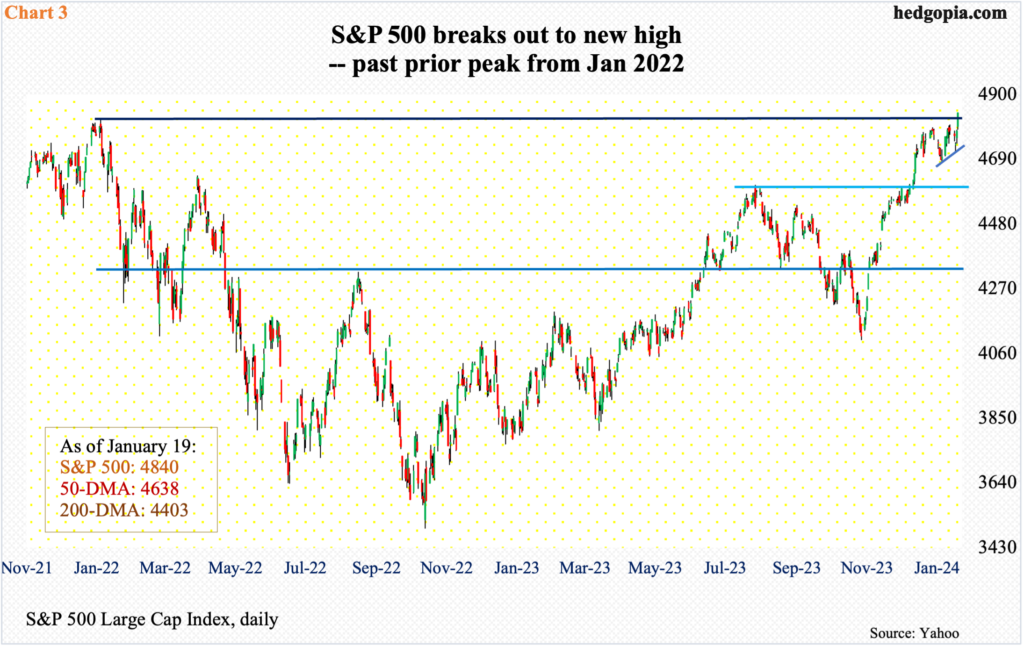
Last week, equities – large-caps in particular – did very well. The S&P 500 jumped 1.2 percent, reversing intraday Wednesday, when it was down 1.4 percent for the week – for a weekly swing of 2.6 percent. By Friday, the index ticked 4842 intraday, closing at 4840.
The S&P 500 had been held down by 4800 since late December. Friday’s 1.2-percent rally not only took care of that resistance but also helped the index break out to a new high – past the prior high of 4819 from January 2022 (Chart 3).
With this, the S&P 500 joins other large cap-dominated indices such as the Dow Industrials and Nasdaq 100, which were already trading at fresh highs. If the S&P 500 breakout is real, it has the potential to be significant. The chink in the bulls’ armor is that small-caps lagged last week – big time.
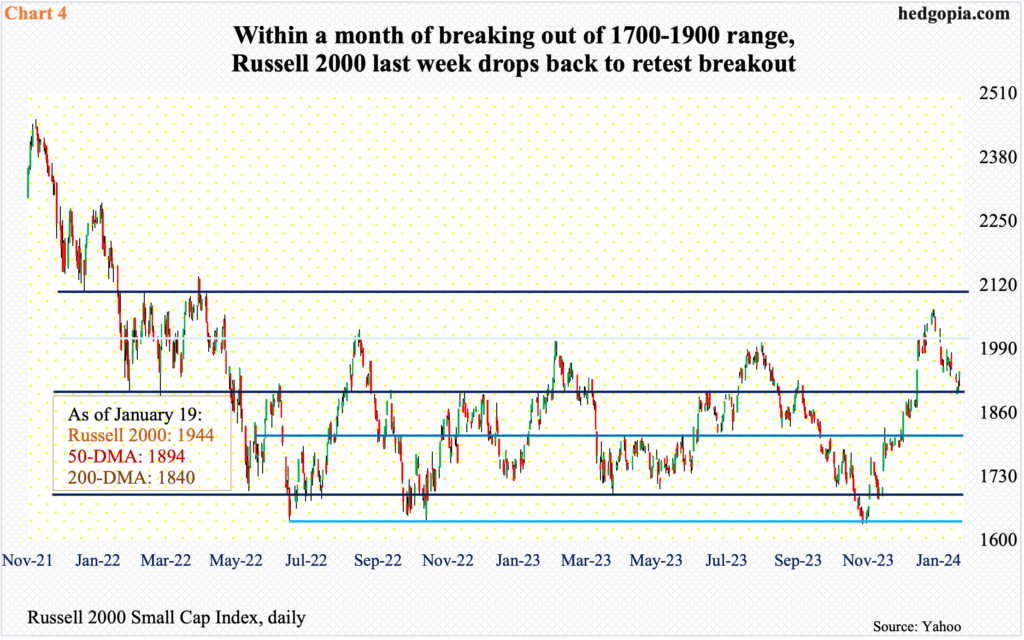
Last week, the Russell 2000 dropped 0.3 percent, and was down as much as 2.7 percent at Wednesday’s low of 1898. Small-cap bulls were forced to defend 1900 again on Thursday, as the index ticked 1902. Bids showed up Friday, but the 1944 close was not enough to push the week into positive territory.
Small-cap bulls’ consolation is that they saved 1900 from breaching. This is an important level. On December 13th, the Russell 2000 broke out of a 200-point range between 1900 and 1700, which had been in place since January last year (Chart 4). A measured-move target of the breakout stood at 2100, and the index reached 2072 on December 27th before pulling back.
More important, The Russell 2000 is nowhere near its all-time high of 2459 from November 2021. Small-caps inherently have a large domestic exposure and are treated as a way to take the pulse of the economy. On that score, it is hard to get too excited about the economy in the quarters ahead.
Large-caps are where money is gravitating toward, and even within that, investors are hiding in the leading few names. The defensive posture is also reflected in investor unwillingness to take on leverage with aggression. If the trend in margin debt seen in November and December persists – or even picks up speed – coupled with continued improvement in flows, then last week’s breakout in the S&P 500 will have the staying power. Barring that, probable strength in the near term will limit to just that – near term.
Thanks for reading!
